Teaching:TUW - UE InfoVis WS 2006/07 - Gruppe 02 - Aufgabe 1 - Table Lens: Difference between revisions
| Line 23: | Line 23: | ||
Cells in the focal area and the table row and column divide the total focus space of each dimension appropriately. [Rao and Card, 1994] | Cells in the focal area and the table row and column divide the total focus space of each dimension appropriately. [Rao and Card, 1994] | ||
=== The Distortion | === The Distortion === | ||
Cells are allocated spaces along each dimension independently, there is an interaction in cell geometry. | Cells are allocated spaces along each dimension independently, there is an interaction in cell geometry. | ||
Revision as of 00:53, 30 October 2006
Definition
[Rao and Card, 1994]
[Rao and Card, 1994]
[Tenev and Rao, 1997]
Table Lens Focus+Context Technique
Focus+Context techniques support visualizing an entire information structure at once as well as zooming in on specific items. [Rao and Card, 1994]
Table Lens Focal Technique
The predominant method in displaying tabular data is using the structured view of a spreadsheet respectively a table. Spreadsheets focus on all datasets appropriately. When the data sets become too large to be displayed in a proper way some other visualisation technique must be found. A Table Lens focuses only on some datasets.
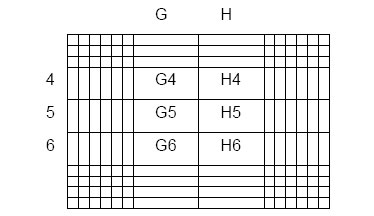
The graph shows a 10 by 14 table with a focal area of 3 by 2 cells. Cells in the focal area and the table row and column divide the total focus space of each dimension appropriately. [Rao and Card, 1994]
The Distortion
Cells are allocated spaces along each dimension independently, there is an interaction in cell geometry. Four types of cell regions are created by the disortion on the two axis: focal, row focal, column focal and nonfocal.
Focal cells are in the focus area along both axes, row focal and column focal are both half focal in that they are in the focal area of only one of the two axes, and nonfocal are in the context area along both axes.
The distortions produced by many focus+context techniques can be described
Example
Displaying an entire dataset in one screen and the use of tabular data.
References
[Tenev and Rao, 1997] T. Tenev, R. Rao, "Managing multiple focal levels in Table Lens," infovis, p. 59, 1997 IEEE Symposium on Information Visualization (InfoVis '97), 1997
[Rao and Card, 1994] R. Rao, S.K. Card. The Table Lens: Merging Graphical and Symbolic Representations in an Interactive Focus+Context Visualization for Tabular Information. In Proceedings of the ACM SIGCHI Conference on Human Factors in Computing Systems. ACM, April 1994. Retrieved at: October 29, 2006. http://www.ramanarao.com/papers/tablelens-chi94.pdf
