Teaching:TUW - UE InfoVis WS 2006/07 - Gruppe 02 - Aufgabe 1 - Table Lens: Difference between revisions
| Line 15: | Line 15: | ||
Focus+Context techniques support visualizing an entire information structure '''at once''' as well as zooming in on specific items. [Rao and Card, 1994] | Focus+Context techniques support visualizing an entire information structure '''at once''' as well as zooming in on specific items. [Rao and Card, 1994] | ||
The predominant method in diplaying tabular data is using the structured view of a table. Spreadsheets focus on all | The predominant method in diplaying tabular data is using the structured view of a spreadsheet respectively a table. Spreadsheets focus on all datasets in an equal proportion. Table Lens focuses only on some datasets. | ||
When the data sets become too large to be displayed in a proper way some other visualisation technique must be found. | When the data sets become too large to be displayed in a proper way some other visualisation technique must be found. | ||
Revision as of 00:01, 30 October 2006
Definition
[Rao and Card, 1994]
[Rao and Card, 1994]
[Tenev and Rao, 1997]
Table Lens Focus+Context Technique
Focus+Context techniques support visualizing an entire information structure at once as well as zooming in on specific items. [Rao and Card, 1994]
The predominant method in diplaying tabular data is using the structured view of a spreadsheet respectively a table. Spreadsheets focus on all datasets in an equal proportion. Table Lens focuses only on some datasets. When the data sets become too large to be displayed in a proper way some other visualisation technique must be found.
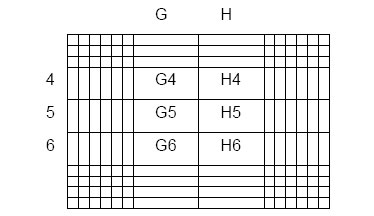
The Table Lens mutates the layout of a table without bending any rows or columns. Cells in the focal area and the table row and column divide the total focus space of each dimension appropriately. [Rao and Card, 1994]
The graph shows a 10 by 14 table with the focal area on rows 4-6 by 2 cells (columns G and H) .
Example
Displaying an entire dataset in one screen and the use of tabular data.
References
[Tenev and Rao, 1997] T. Tenev, R. Rao, "Managing multiple focal levels in Table Lens," infovis, p. 59, 1997 IEEE Symposium on Information Visualization (InfoVis '97), 1997
[Rao and Card, 1994] R. Rao, S.K. Card. The Table Lens: Merging Graphical and Symbolic Representations in an Interactive Focus+Context Visualization for Tabular Information. In Proceedings of the ACM SIGCHI Conference on Human Factors in Computing Systems. ACM, April 1994. Retrieved at: October 29, 2006. http://www.ramanarao.com/papers/tablelens-chi94.pdf
