Teaching:TUW - UE InfoVis WS 2006/07 - Gruppe 02 - Aufgabe 1 - Table Lens: Difference between revisions
No edit summary |
|||
| Line 16: | Line 16: | ||
'''''focus+context''''' or '''''fisheye''''' technique. [Rao and Card, 1994] | '''''focus+context''''' or '''''fisheye''''' technique. [Rao and Card, 1994] | ||
=== Table Lens Focus+Context Technique === | === Table Lens Focus+Context Technique === | ||
| Line 25: | Line 24: | ||
regularity of its content: information along rows or columns is interrelated, and can be interpreted on some reading as a coherent set, e.g. members of a group or attributes of an object. This is reflected in the fact that tables usually have | regularity of its content: information along rows or columns is interrelated, and can be interpreted on some reading as a coherent set, e.g. members of a group or attributes of an object. This is reflected in the fact that tables usually have | ||
labels at row and column edges that identify some portion of the meaning of the items in the row or column. These observations indicated a need to preserve the coherence of rows and columns and their labels despite distortions to | labels at row and column edges that identify some portion of the meaning of the items in the row or column. These observations indicated a need to preserve the coherence of rows and columns and their labels despite distortions to | ||
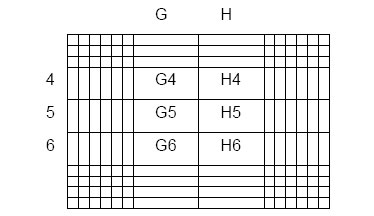
The Table Lens mutates the layout of a table without bending any rows or columns. Cells in the focal area and the table row and column divide the total focus space of each dimension appropriately. [Rao and Card, 1994] | |||
[[Image:TableLensTechnique.jpg]] | |||
The graph shows a 10 by 14 table with the focus area on rows 4-6 by 2 cells. | |||
== Examples == | == Examples == | ||
Revision as of 17:41, 29 October 2006
Definition
[Rao and Card, 1994]
[Rao and Card, 1994]
[Tenev and Rao, 1997]
Description | Background | Technique
Displaying certain amounts of tabular data on the display of a computer screen in a lucid way can be seen as one of the motivations for developing this visualization. A spreadsheet can display a maximum of 660 cells at once on a 19 inch display (at cell size of 100 by 15 pixels, 82dpi). [Rao and Card, 1994] The Table Lens can comfortably manage about 30 times as many cells and can display up to 100 times as many cells in support of many tasks. The scale advantage is obtained by using a so-called focus+context or fisheye technique. [Rao and Card, 1994]
Table Lens Focus+Context Technique
Focus+Context techniques support visualizing an entire information structure at once as well as zooming in on specific items. This interplay between focus and context supports searching for patterns in the big picture and fluidly investigating interesting details without losing framing context.
The Table Lens technique has been motivated by the particular nature of tables. The most salient feature of a table is the regularity of its content: information along rows or columns is interrelated, and can be interpreted on some reading as a coherent set, e.g. members of a group or attributes of an object. This is reflected in the fact that tables usually have labels at row and column edges that identify some portion of the meaning of the items in the row or column. These observations indicated a need to preserve the coherence of rows and columns and their labels despite distortions to
The Table Lens mutates the layout of a table without bending any rows or columns. Cells in the focal area and the table row and column divide the total focus space of each dimension appropriately. [Rao and Card, 1994]
The graph shows a 10 by 14 table with the focus area on rows 4-6 by 2 cells.
Examples
References
[Tenev and Rao, 1997] T. Tenev, R. Rao, "Managing multiple focal levels in Table Lens," infovis, p. 59, 1997 IEEE Symposium on Information Visualization (InfoVis '97), 1997
[Rao and Card, 1994] R. Rao, S.K. Card. The Table Lens: Merging Graphical and Symbolic Representations in an Interactive Focus+Context Visualization for Tabular Information. In Proceedings of the ACM SIGCHI Conference on Human Factors in Computing Systems. ACM, April 1994. Retrieved at: October 29, 2006. http://www.ramanarao.com/papers/tablelens-chi94.pdf
