Teaching:TUW - UE InfoVis WS 2005/06 - Gruppe G4 - Aufgabe 3 - Design: Difference between revisions
| Line 67: | Line 67: | ||
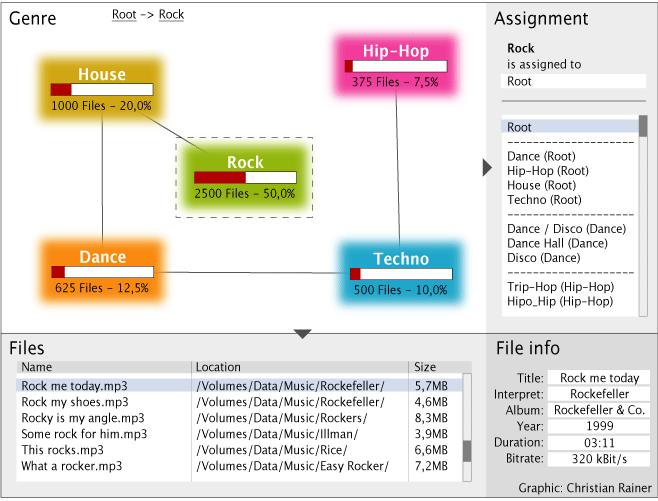
=== Mockup / Fake Screenshot === | === Mockup / Fake Screenshot === | ||
[[Image:MP3_Viewer.gif]] | [[Image:MP3_Viewer.gif]] | ||
Revision as of 06:00, 22 November 2005
Specification of the Application Area and the given Dataset
Analysis of the Target User Group
Intended Purpose of our Visualization
Proposal of Design
Types of Visualization applied
As there are no comparable features implemented in existing mp3 archival storage systems we decided to implement a visualization kit exploring the quantitative distribution of an mp3-archive according to the different genres. As a default the main window shows several genres the authors considered to be the right ones for music main-genres in the root directory including their percentage-rate corresponding to the whole file-archive.
By a single click on one of the main genres the user gets additional information in the right window on the one hand and of course a file-listing in the lower left window on the other hand. Double clicking a genre in the main window brings the user straight to a sub-level containing the corresponding sub-genres again shown in the main window. Through the path shown on top of the main window the system allows to easily jump back to wherever necessary out of every level.
Further on the user is able to read out file-specific information like Title, Interpret,
Album, Year, Duration & Bit-Rate through a click on the particular file listed below, but is also allowed to save a play-list from the files selected via the file-explorer.
Following feature turns the visualization kit into a rather complex and outstanding tool. By default the tool sorts the input data through a given hierarchy according to the main genres and alternatively to the sub-genres following the ID3-Tags. Additionally the User has the ability to change this system and to create his own view according to his point of interest. That means that he is able to change the main genres and the sub-genres as well. As there are always different views especially on the terms of sub-genres the user is even allowed to change the structure of the given categories. That means that one is permitted to extract an ambiguous sub-genre to directly attach it to another genre. This will be able via the right middle window showing the sub-genres and their actual belongings as well. Probably the system will give the possibility to cancel unmeant genres at all.
Visual Mapping
- Due to the enormous number of music-genres ID3-Tags provide we will probably choose a tree structure in addition to the text-based genre-navigator on the right in lower levels. This structure should be similar to a hyperbolic tree.
Dimension "Genre-Multitude" --> visual attribute "Tree Branches"
- To afford best visualization we are right now not sure whether we should display the percentage-rate in bars as shown in the fake-screenshot below, or should rather use a Bubble-Chart, where the size of the bubbles is determined by the values of occurrence per genre.
Dimension "File-Occurrence" --> visual attribute "Area"
Specification of used Techniques / applied Principles
- Hyperbolic Trees:
(s. slide 18, 19, 20 of Info_Vis4.pdf handed out in the course “188.305 VO Informationsvisualisierung”)
Due to the enormous number of music-genres ID-3 Tags provide we probably choose a tree structure similar to a hyperbolic tree to visualize the raw data extracted from the corresponding mp3-archiv.
- Bubble Chart:
(s. similar to bubble-maps, slide 52 of Info_Vis4.pdf handed out in the course 188.305 VO Informationsvisualisierung, http://peltiertech.com/Excel/ChartsHowTo/HowToBubble.html)
Bubble chart, where the size of the bubbles is determined by the values of occurrence.
- Details on demand:
(s. slide 55 of Info_Vis4.pdf handed out in the course 188.305 VO Informationsvisualisierung)
Used several times. (File-Explorer, Genre-Information, ...)
- Linking & Brushing:
(s. slide 100 of Info_Vis0.pdf handed out in the course 188.305 VO Informationsvisualisierung)
Detail Windows containing percentage-distribution according to the specific genre
- Focus & Context: Tiled Multi-Level Browser
(slide 69 of Info_Vis0.pdf handed out in the course 188.305 VO Informationsvisualisierung)
Overview Window, Details on Demand Window
