Search results
Jump to navigation
Jump to search
Create the page "User" on this wiki! See also the search results found.
Page title matches
 (290 × 199 (37 KB)) - 16:18, 24 October 2010
 Image of the User UE-InfoVis1011_0325435 aka Jorit Posset ...(300 × 200 (5 KB)) - 04:29, 25 October 2010


Page text matches
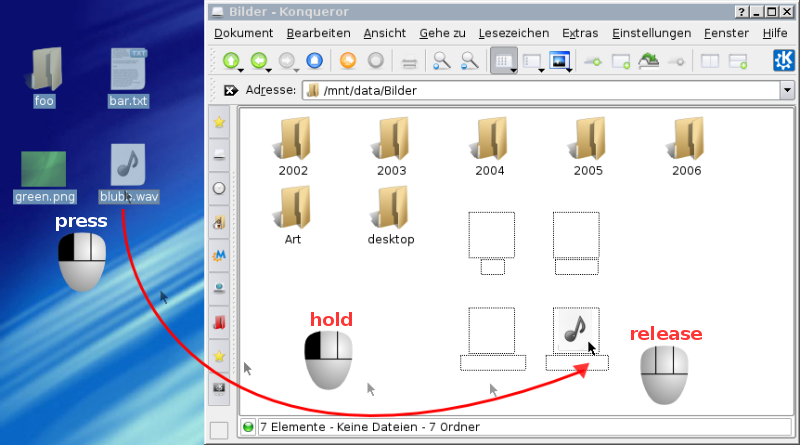 Created by [http://commons.wikimedia.org/wiki/User:Sven Wikipedia User Sven] (Creative Commons Attribution ShareAlike 3.0) ...User: Sven], 2008] [http://commons.wikimedia.org/wiki/User:Sven Wikipedia User: Sven]. Drag and Drop on KDE. Created at: August 5, 2008. Retrieved at: Nov ...(800 × 445 (193 KB)) - 18:59, 6 November 2009
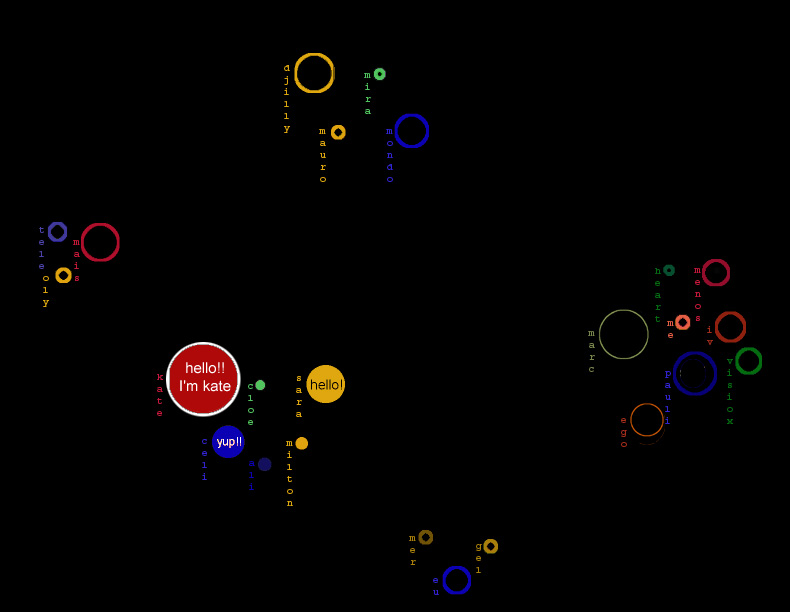 ...round the screen; clusters of activity are immediately apparent. The local user's own circle appears outlined in white. ...(790 × 612 (58 KB)) - 16:37, 1 December 2006
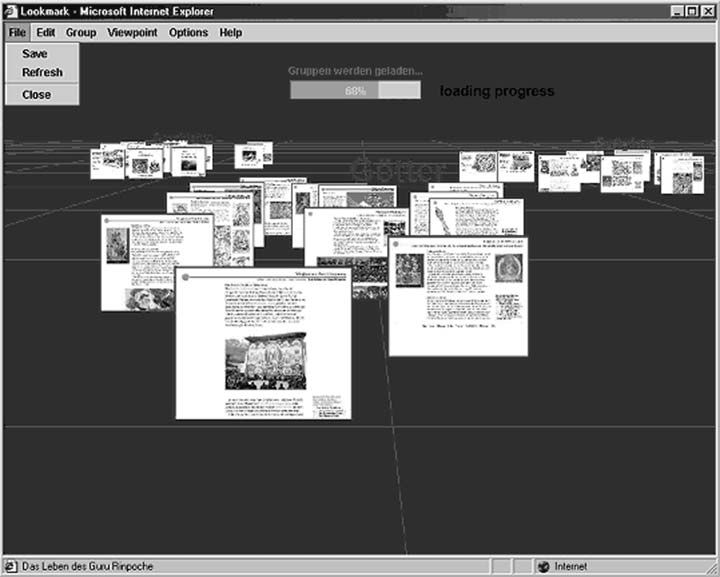 Lookmark user interface screenshot. The user interface consists of a 2D ...(720 × 577 (46 KB)) - 23:35, 6 November 2009
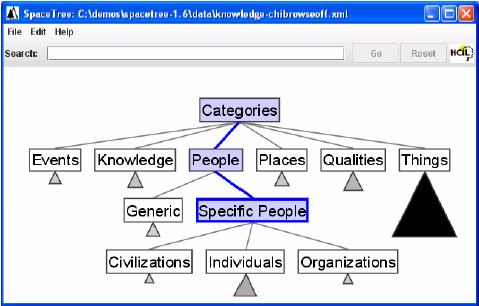 ...e trees, shows a partially expanded tree with aggregation markers that are user expandable. ...(479 × 306 (29 KB)) - 20:47, 25 May 2009
- Image of the User UE-InfoVis1011_0325435 aka Jorit Posset ...(300 × 200 (5 KB)) - 04:29, 25 October 2010
 [Waloszek, 2008] Gerd Waloszek, SAP AG, SAP User Experience,Selecting Objects By Attributes – Part II. Created at: October ...(560 × 410 (56 KB)) - 09:51, 26 November 2008
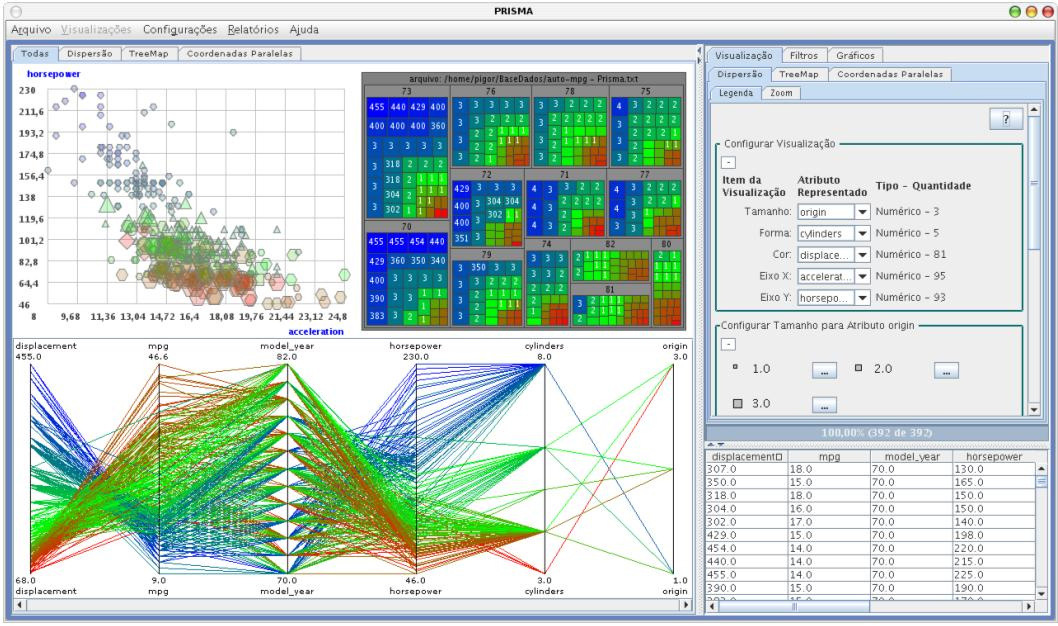 This figure shows the main User Interface of Prisma after loading a dataset. All options are in Portoguese. ...(1,058 × 626 (314 KB)) - 18:39, 9 June 2008
 This figure shows the main User Interface of Prisma after loading a dataset. All options are in Portoguese. ...(1,058 × 626 (314 KB)) - 18:42, 9 June 2008
 Created by: [[User:UE-InfoVis0910_0625847|Richard Kloibhofer]] ...(366 × 278 (4 KB)) - 12:25, 21 November 2009
 Created by: [[User:UE-InfoVis0809_9607701|Axel Goldmann]] ...(535 × 423 (28 KB)) - 18:22, 4 November 2009
 Created by: [[User:UE-InfoVis0809_9607701|Axel Goldmann]] ...(535 × 423 (24 KB)) - 18:58, 4 November 2009
 User: UE-InfoVis0506 0026629 ...(366 × 123 (7 KB)) - 14:58, 27 October 2005
 [[User:Iwolf|Wolfgang Aigner]] ...(200 × 113 (4 KB)) - 21:24, 29 September 2005
 User: UE-InfoVis0506 0026629 ...(444 × 65 (8 KB)) - 14:58, 27 October 2005
 User: UE-InfoVis0506 0026629 ...(423 × 65 (7 KB)) - 14:59, 27 October 2005
 ...ruvé, 1995] Christopher Ahlberg and Staffan Truvé, Tight Coupling: Guiding User Actionsin a Direct Manipulation Retrieval System, Chalmers University of Te ...(390 × 70 (12 KB)) - 14:31, 27 April 2006
 ...ruvé, 1995] Christopher Ahlberg and Staffan Truvé, Tight Coupling: Guiding User Actionsin a Direct Manipulation Retrieval System, Chalmers University of Te ...(320 × 80 (13 KB)) - 14:32, 27 April 2006
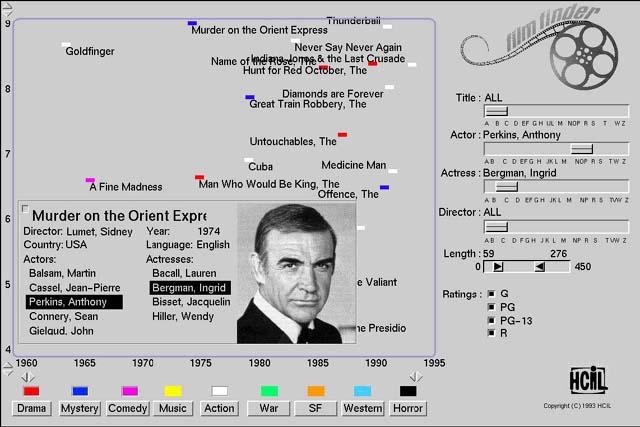 ...ruvé, 1995] Christopher Ahlberg and Staffan Truvé, Tight Coupling: Guiding User Actionsin a Direct Manipulation Retrieval System, Chalmers University of Te ...(640 × 427 (68 KB)) - 14:32, 27 April 2006
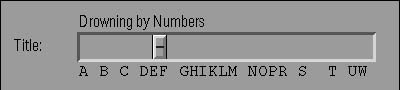 ...ruvé, 1995] Christopher Ahlberg and Staffan Truvé, Tight Coupling: Guiding User Actionsin a Direct Manipulation Retrieval System, Chalmers University of Te ...(400 × 90 (16 KB)) - 14:31, 27 April 2006
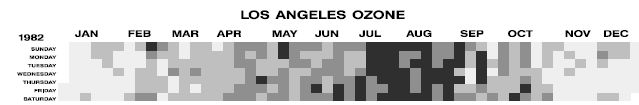 ...Air Quality Trends with SAS/GRAPH. In ''Proceedings of the 22nd Annual SAS User Group International Conference (SUGI97)'', pages 807–812, 1997. [http://i ...(639 × 105 (13 KB)) - 14:33, 27 November 2006
 algorithm as seen in the graphical user interface ...(376 × 309 (20 KB)) - 09:31, 23 April 2008
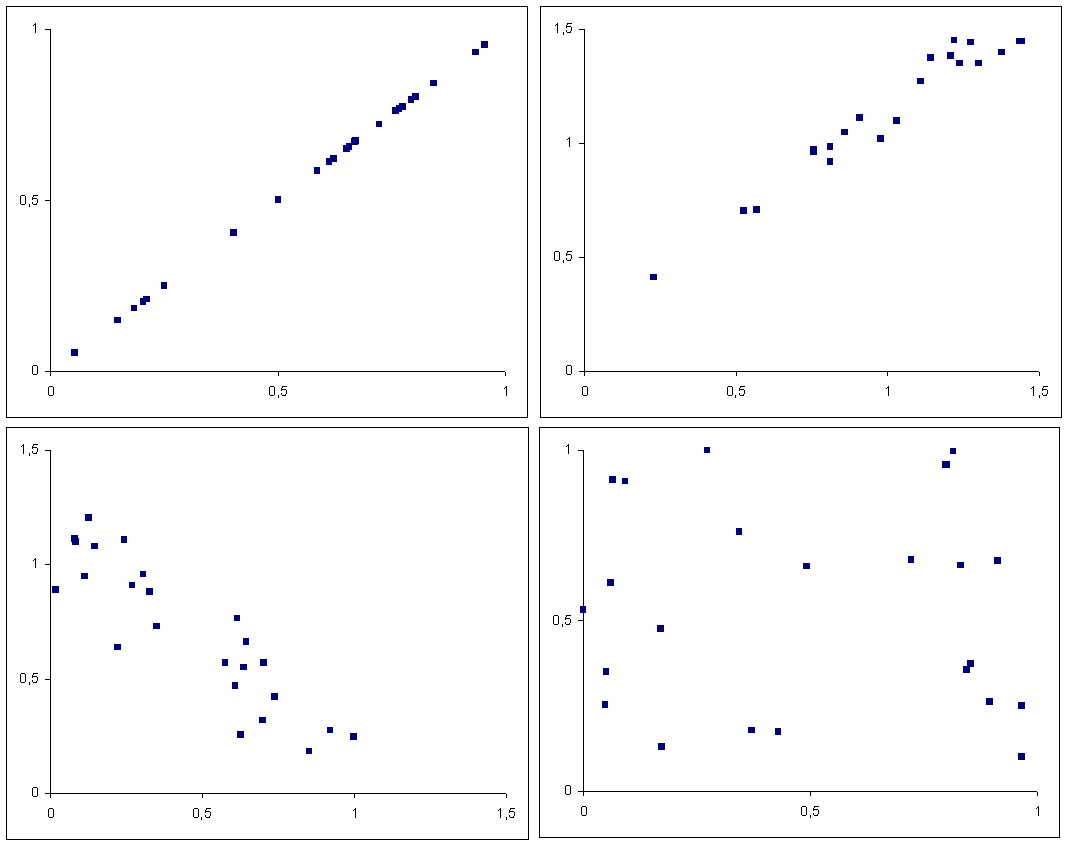 Created by: [[User:UE-InfoVis0809_9607701|Axel Goldmann]] ...(1,068 × 844 (63 KB)) - 18:52, 4 November 2009
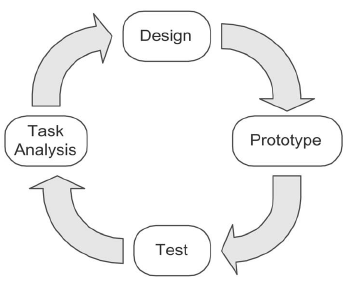 User-Centered Design - Design cycle ...(349 × 287 (32 KB)) - 11:05, 7 June 2006
 ...004] Klaus Hinum, Master's Thesis about Human centred Design for Graphical User Interfaces, February 2004. ...(301 × 268 (12 KB)) - 22:04, 3 November 2005
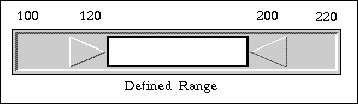 A sample range slider. By moving the arrows, the user specifies the range, which is represented by the white rectangle. The numbe ...(358 × 104 (4 KB)) - 13:58, 30 October 2006
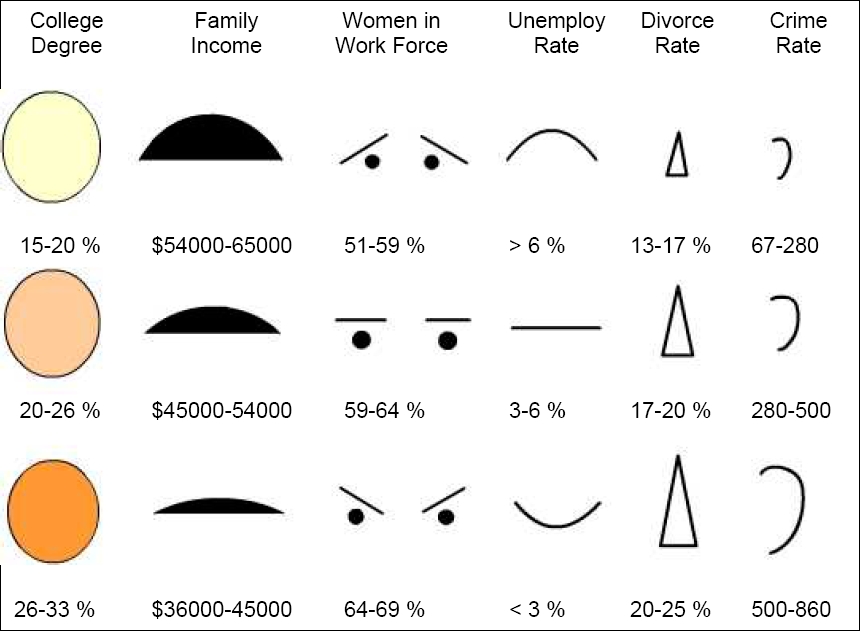 .... "Mapping Quality of Life with Chernoff Faces", 4th Annual ESRI Education User Conference 2004, San Diego, CA, August 2004. http://downloads2.esri.com/cam ...(860 × 631 (126 KB)) - 19:57, 4 November 2009
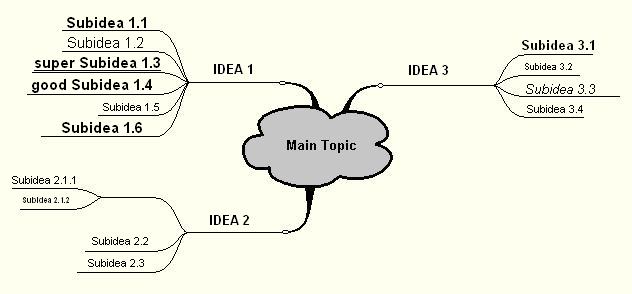 own creation ([[User:UE-InfoVis0809_0401831]]) ...(632 × 294 (23 KB)) - 20:54, 4 November 2009
 own creation ([[User:UE-InfoVis0809_0401831]]) ...(174 × 105 (4 KB)) - 20:50, 4 November 2009
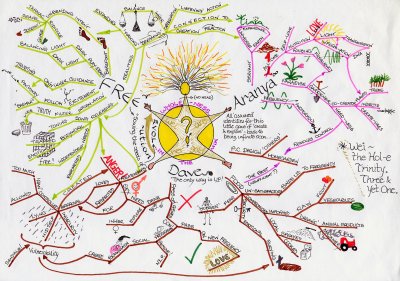 A hand-drawn Mind Map from '''Aranya''' added by [[User:UE-InfoVis0809_0401831]] ...(400 × 281 (44 KB)) - 20:48, 4 November 2009
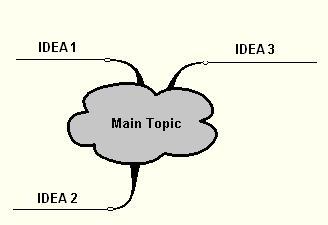 own creation ([[User:UE-InfoVis0809_0401831]]) ...(328 × 225 (7 KB)) - 20:52, 4 November 2009
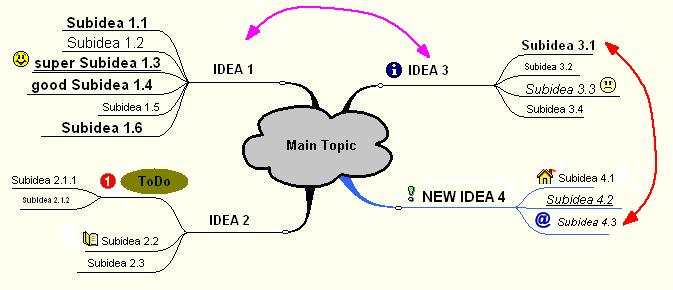 own creation ([[User:UE-InfoVis0809_0401831]]) ...(673 × 290 (33 KB)) - 20:57, 4 November 2009
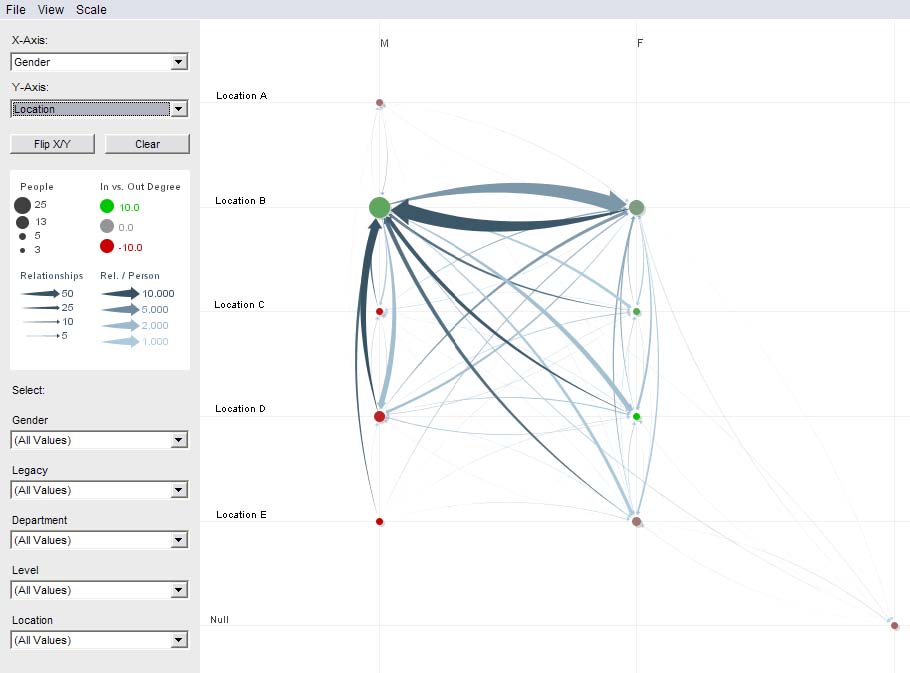 User interface of PivotGraph ...(910 × 673 (52 KB)) - 10:26, 26 May 2009


