File:Perceptualedge03world-car-production.gif: Difference between revisions
Jump to navigation
Jump to search
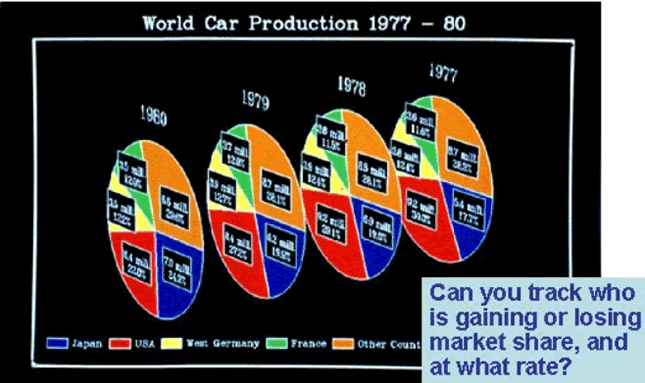
(Multiple 3D Pie Chart of World Car Production 1977-80) |
(→Source) |
||
| Line 5: | Line 5: | ||
== Source == | == Source == | ||
[Perceptual Edge, 2003] Perceptual Edge, World Car Production 1977-80, Design Example #7. Created at: 2003. Retrieved at: Oct. 10, 2005. | [Perceptual Edge, 2003] Perceptual Edge, World Car Production 1977-80, Design Example #7. Created at: 2003. Retrieved at: Oct. 10, 2005. | ||
originally published in: | |||
[Brown et al., 1995] Judith R. Brown et al., Visualization: Using Computer Graphics to Explore Data and Present Information, John Wiley & Sons, 1995. | |||
Latest revision as of 09:44, 25 October 2005
Summary[edit]
Multiple 3D Pie Chart of World Car Production 1977-80
Copyright status[edit]
Source[edit]
[Perceptual Edge, 2003] Perceptual Edge, World Car Production 1977-80, Design Example #7. Created at: 2003. Retrieved at: Oct. 10, 2005.
originally published in:
[Brown et al., 1995] Judith R. Brown et al., Visualization: Using Computer Graphics to Explore Data and Present Information, John Wiley & Sons, 1995.
File history
Click on a date/time to view the file as it appeared at that time.
| Date/Time | Thumbnail | Dimensions | User | Comment | |
|---|---|---|---|---|---|
| current | 09:44, 25 October 2005 |  | 645 × 383 (67 KB) | Iwolf (talk | contribs) | Multiple 3D Pie Chart of World Car Production 1977-80 |
You cannot overwrite this file.
File usage
The following page uses this file: