Explode to Explain: Difference between revisions
(New page: == Authors == Martin Lubschik <br/>| Heidrun Schumann<br/> == Short description == The basic problem behind this technique is, the complexity and sophistication of visualization techniq...) |
No edit summary |
||
| Line 12: | Line 12: | ||
== Figures == | == Figures == | ||
[[Image:Explode1.jpg]] <br/> | |||
[[Image:Explode2.jpg]] <br/> | |||
[[Image:Explode3.jpg]] <br/> | |||
[[Image:Explode4.jpg]] <br/> | |||
| Line 24: | Line 27: | ||
== Evaluation == | == Evaluation == | ||
| Line 41: | Line 36: | ||
== References == | == References == | ||
[[Category:Techniques]] | [[Category:Techniques]] | ||
Revision as of 17:24, 7 May 2008
Authors
Martin Lubschik
|
Heidrun Schumann
Short description
The basic problem behind this technique is, the complexity and sophistication of visualization techniques used to visualize constantly growing large data volumes and complex interrelationships. Traditional and easily self-explanatory techniques are not appropriate to visualize more complex interrelationships. On the other hand more complex visualization techniques are often very hard to understand for non expert people.
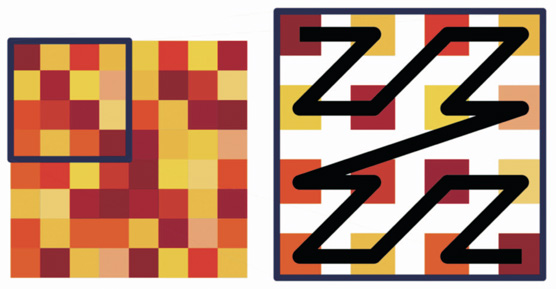
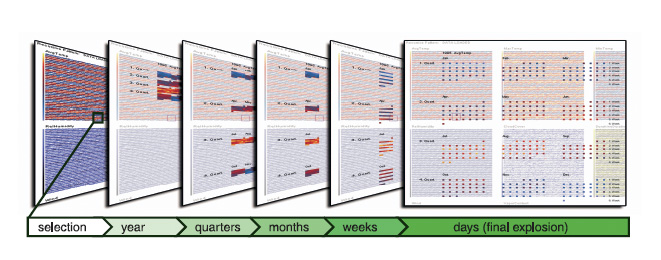
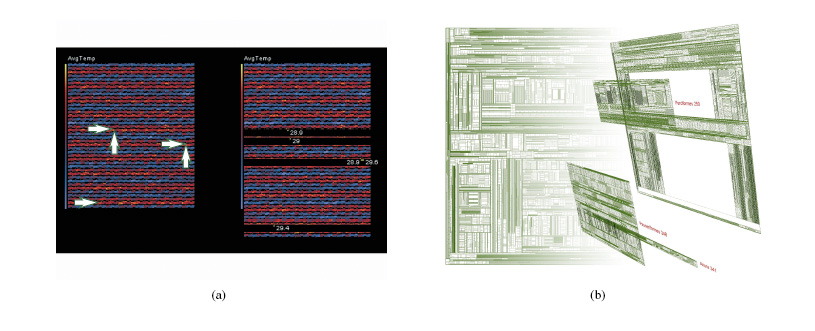
Exploded views are used widely in for example technical drawings. The idea is to show all details of a complicated construction by exploding the components and then showing the relationships of the components. Luboschik and Schumann (2007) propose the use of explosion for explaining the more complex information visualization technologies.
Figures


