Gravi

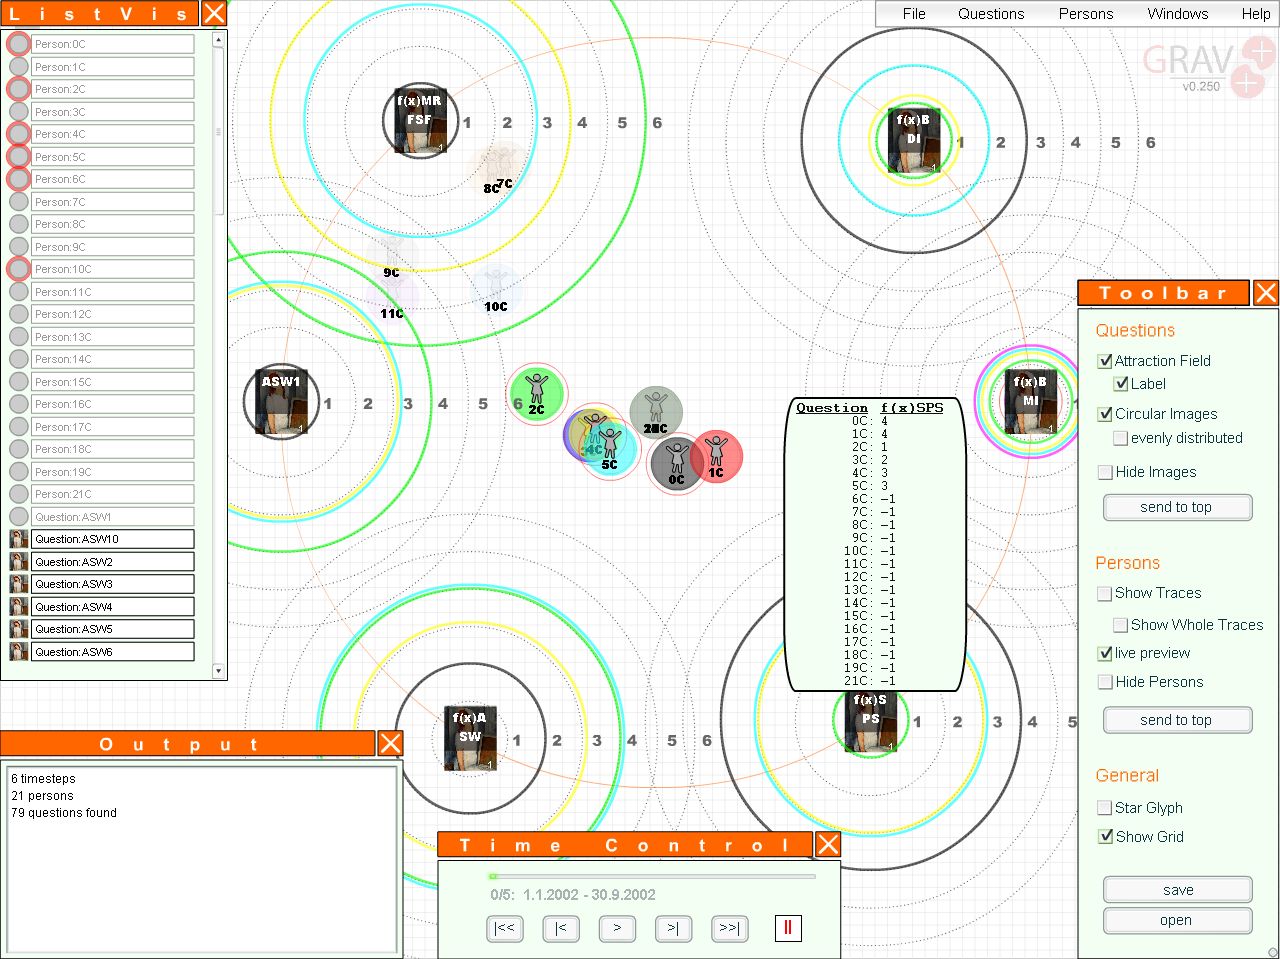
Gravi++ is an interactive Information Visualization for highly structured temporal data. It consists out of two overview visualizations (a simple list based and a more advanced small multiples based one) and a spring based core.
Gravi++ was created in the in2vis Project to gain new insights in the human reasoning process.

References
- Hao Ming C., Dayal Umeshwar, Cotting Daniel, Holenstein Thomas, Gross Markus. Accelerated force computation for physics-based information visualization. Proceedings of the symposium on Data visualisation 2003 VISSYM '03, Eurographics Association, 2003.
- Hao Ming C., Garg Pankaj, Dayal Umeshwar, Machiraju Vijay, Cotting Daniel. Case studies: information visualization and user interaction: Visualization of large web access data sets. Proceedings of the symposium on Data Visualisation 2002 VISSYM '02, Eurographics Association, 2002.