File:Proportion.gif
Proportion.gif (319 × 373 pixels, file size: 11 KB, MIME type: image/gif)
Summary
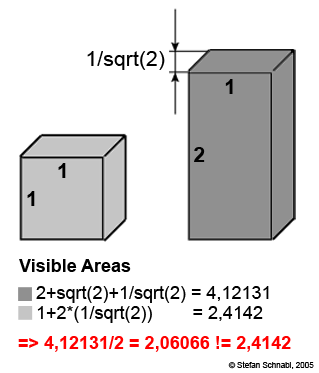
Giving an easy example why the actually visible areas in a 3D bar chart are not proportional to the represented values.
Copyright status
Stefan Schnabl, 2005
Source
Stefan Schnabl, 2005
File history
Click on a date/time to view the file as it appeared at that time.
| Date/Time | Thumbnail | Dimensions | User | Comment | |
|---|---|---|---|---|---|
| current | 20:38, 28 October 2005 |  | 319 × 373 (11 KB) | UE-InfoVis0506 0306110 (talk | contribs) | Giving an easy example why the actually visible areas in a 3D bar chart are not proportional to the represented values. |
You cannot overwrite this file.
File usage
There are no pages that use this file.