Radial Hierarchical Visualization
Authors
Schreck, Tobias
Short Description
Suitable Data Types
Suitable data types for this information visualization technique are Internet Protocol packets.
Figures
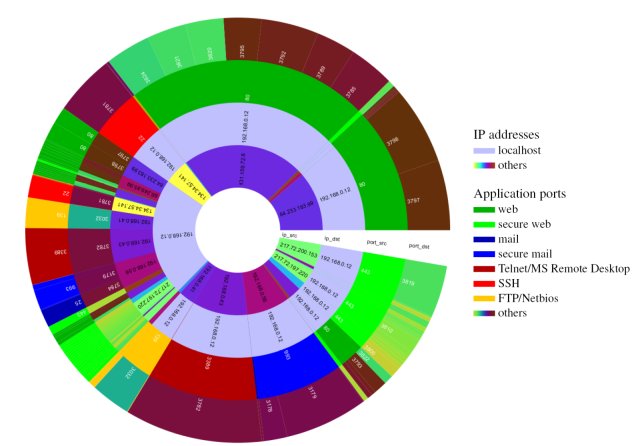
The Radial Traffic Analyzer visualizes network traffic using a radial hierarchical layout. The radial visualization was chosen to display data with the same level of importance. Users interpreting a left-to-right layout may assign more importance to an item on one side due to the cultural reading direction. In the default configuration, the Radial Traffic Analyzer uses four concentrical rings, each one representing an attribute of the transferred packets.
The rings in this example show the following information, from the innermost to the outermost ring:
1. Source IP adress
2. Destination IP
3. Source port number
4. Destination port number.
The share in total traffic determines the size of a single circle segment. To improve readability, entries with the same value (e.g., the same IP, or the same port number) always use the same colour. Popular port numbers appear in reserved, unique colours (e.g. green is always used for port 80 - HTTP), which are not used again to display something else. Traffic over secured channels is shown in brighter colours, whereas traffic over unsecured channels appears in darker colour.
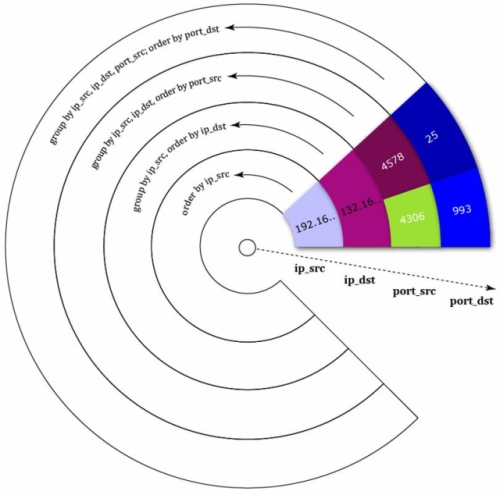
Circle segments are sorted on a ring, and grouped by the attributes on the inner rings. The next figure shows the design rationale:
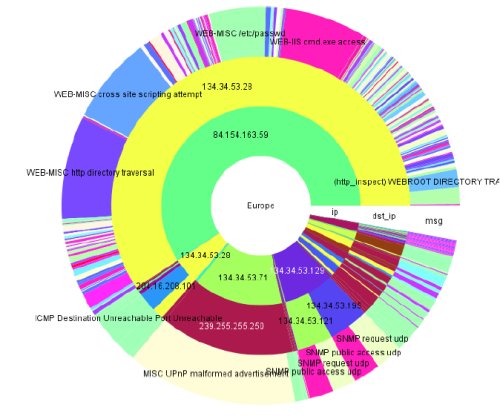
The Radial Traffic Analyzer allows a variety of user interaction. Entries and their associated traffic can be filtered by single-clicking a circle segment. The order of the rings can be adapted to the users' needs, as well as the number of the rings, or their attributes. For example, the Radial Traffic Analyzer can be configured to display security alerts generated by an intrusion detection system:
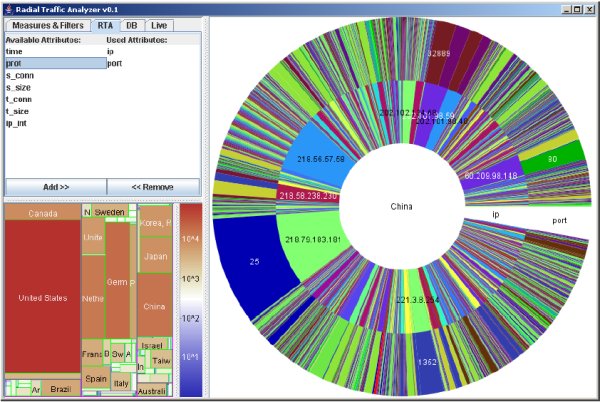
As seen in the figure above, the innermost circle can be used to limit the source of network traffic to one specified country. For this purpose, the Radial Traffic Analizer uses the Maxmind’s GeoIP Database to evaluate the geo-location information. Geographical information is arranged on a treemap using the HistoMap algorithm; each geographical unit is matched to a rectangle. The amount of traffic determines the rectangle size.
Evaluation
As per April 2007, there are no evaluations or reference implementations of the Radial Traffic Analyzer.
References
[Keim, et. al. 2006] Daniel A. Keim, Florian Mansmann, Jörn Schneidewind, and Tobias Schreck: "Monitoring Network Traffic with Radial Traffic Analyzer", pages 123-128. IEEE Symposium on Visual Analytics Science and Technology 2006.
Evaluation References
A formal user study is pending as per April 2007. However, previous evaluations have been conducted, e.g.:
- [Komlodi, et. al., 2005] Komlodi, A.; Rheingans, P.; Ayachit, U.; Goodall, J.R.; Joshi, A.; "A User-centered Look at Glyph-based Security Visualization", Visualization for Computer Security, IEEE Workshops on Publication Date: 26 Oct. 2005 On page(s): 3- 3
- [Stasko, et. al., 2000] Stasko, J.; Zhang, E.; "Focus+context display and navigation techniques for enhancing radial, space-filling hierarchy visualizations", Information Visualization, 2000. InfoVis 2000. IEEE Symposium on Publication Date: 2000 On page(s): 57-65


