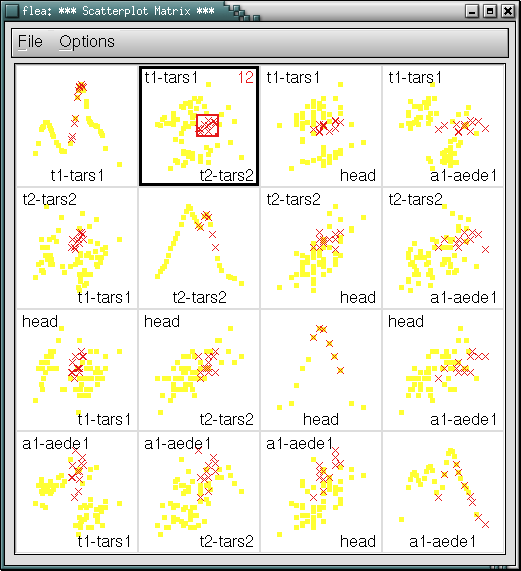
Linking and Brushing

[Voigt, 2002]
The idea of linking and brushing is to combine different visualization methods to overcome the shortcomings of single techniques. Interactive changes made in one visualization are automatically reflected in the other visualizations. Note that connecting multiple visualizations through interactive linking and brushing provides more information than considering the component visualizations independently.
[Keim, 2002]
Linking and brushing are interaction techniques. They can be used to enhance the work with scatterplot matrices, parallel coordinates and many other InfoVis techniques
Brushing means selecting a subset of the data items with an input device (mouse). This is usually done to highlight this subset, but it can also be done to delete it from the view or to de-emphasize it, if the user wants to focus on the other items.
Brushing is most interesting in connection with linking. For instance in a scatterplot matrix, the user could brush some points in one plot. This causes the brush effect (highlighting, etc.) to be applied on those points in the other plots that represent the same data items.
[Voigt, 2004]
By linking, we mean showing how a point, or set of points, behaves in each of the plots. This is accomplished by highlighting these points in some fashion. For example, the highlighted points could be drawn as a filled circle while the remaining points could be drawn as unfilled circles. A typical application of this would be to show how an outlier shows up in each of the individual pairwise plots. Brushing extends this concept a bit further. In brushing, the points to be highlighted are interactively selected by a mouse and the scatterplot matrix is dynamically updated (ideally in real time). That is, we can select a rectangular region of points in one plot and see how those points are reflected in the other plots.
[NIST/SEMATECH, 2004]
References
- [Keim, 2002]: D. A. Keim, Information Visualization and Visual Data Mining, IEEE Transactions on Visualization and computer graphics, 2002.
- [Voigt, 2002]: Robert Voigt, An Extended Scatterplot Matrix and Case Studies in Information Visualization, Master's thesis, Hochschule Magdeburg-Stendal, 2002, Linking and brushing
- [Saake et al., 2000]: Gunter Saake, Kai-Uwe Sattler, Daniel Keim, Datenbank- und Visualisierungstechnologie in der Informationsfusion', Fakultät für Informatik, Universität Magdeburg, 2000.
- [NIST/SEMATECH, 2004]: NIST/SEMATECH, e-handbook of statistical methods, Retrieved at: November 2004. http://www.itl.nist.gov/div898/handbook/