File:Tilemaps color.jpg

Size of this preview: 467 × 599 pixels. Other resolution: 469 × 602 pixels.
Original file (469 × 602 pixels, file size: 92 KB, MIME type: image/jpeg)
Summary
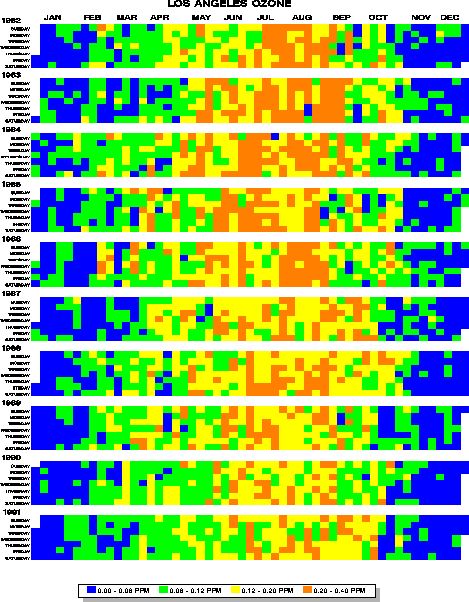
a tilemap showing different levels of ocone concentration, color-coded, in Los Angeles over several years.
Copyright status
Source
[Friendly, 2006] Michael Friendly. Gallery of Data Visualization. York University: Statistical Consulting Service and Psychology Department. Accessed: 27.11.2006. Gallery of Data Visualization
File history
Click on a date/time to view the file as it appeared at that time.
| Date/Time | Thumbnail | Dimensions | User | Comment | |
|---|---|---|---|---|---|
| current | 13:38, 27 November 2006 |  | 469 × 602 (92 KB) | UE-InfoVis0607 9926534 (talk | contribs) | a tilemap showing different levels of ocone concentration in Los Angeles over several years. |
You cannot overwrite this file.
File usage
The following page uses this file: