Data Visualization
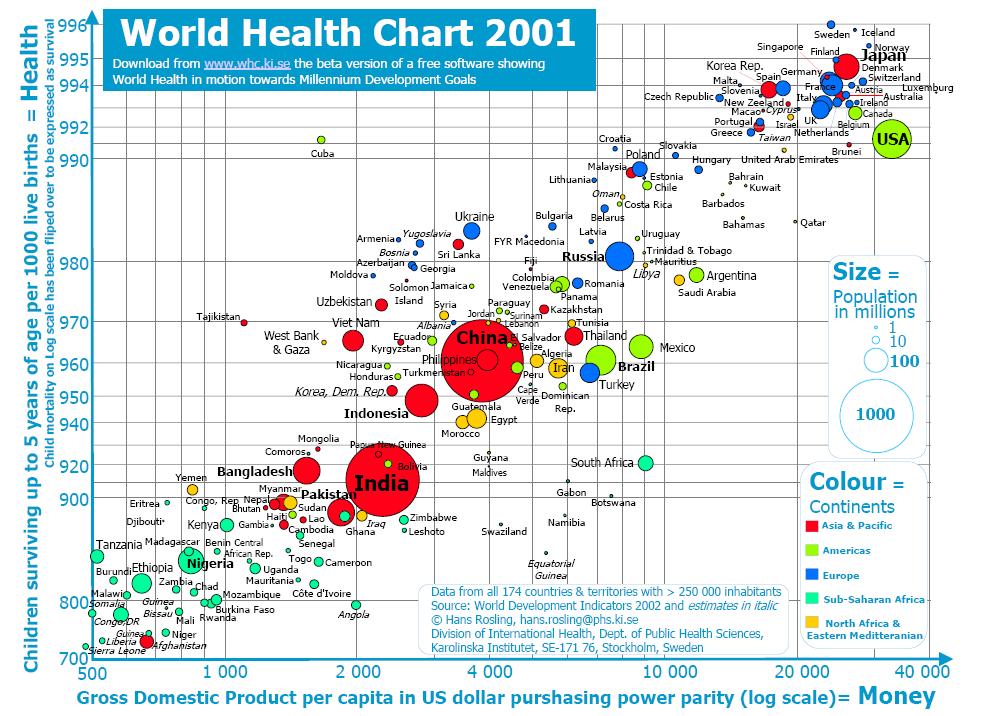
Data visualization is the process of using graphical presentation to represent complex data in a way that provides the viewer with a qualitative understanding of its information contents, turning complicated sets of data into visual insights.
[Bhargava, 2003]

... the science of visual representation of “data”, defined as information which has been abstracted in some schematic form, including attributes or variables for the units of information.
[Friendly and Denis, 2004]
References
- [Bhargava, 2003]: Bharat Bhargava, Data Visualization Overview, 2003.
- [Friendly and Denis, 2004]: Michael Friendly and Daniel J. Denis, Milestones in the history of thematic cartography, statistical graphics, and data visualization, April 14, 2004. http://www.math.yorku.ca/SCS/Gallery/milestone/