CourseVis
Authors
Short Description
Suitable Datatypes
This method can be used for tracking data generated by course management systems (CMS). Currently, the only supported CMS is WebCT.
Figures
Social Aspects:
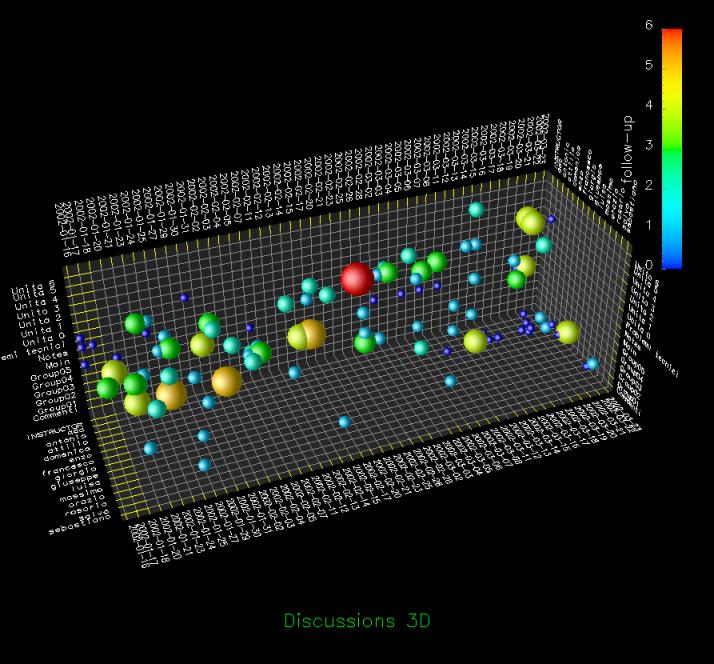
This plot is a representation of the students' social activities (i.e. in a discussion board); It allows different views on aspects like date, student or topic. The size of the point describes the intensity and the color the activity a student did (red for start a topic, green for an answer and blue for reading).

Cognitive Aspects:
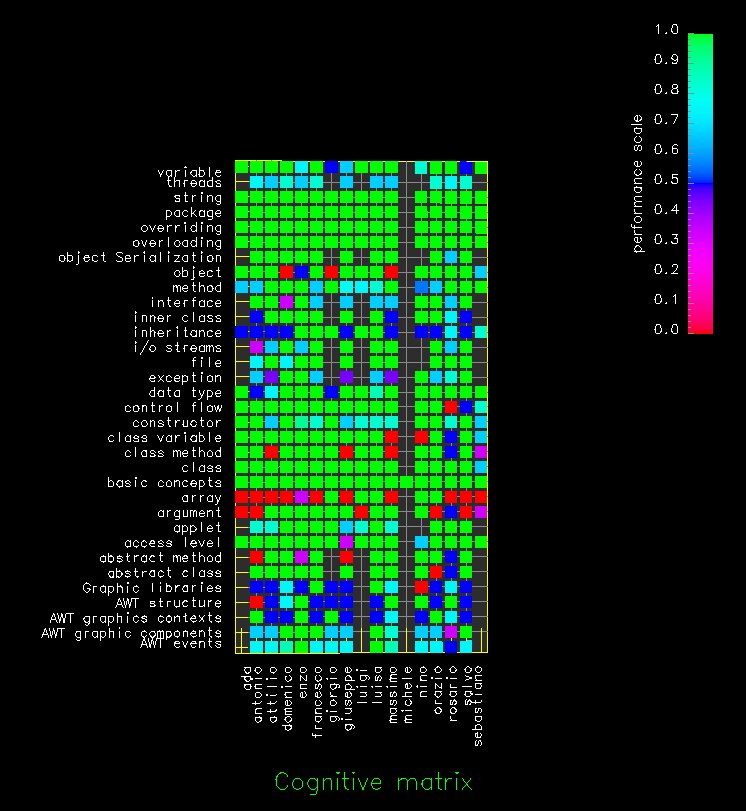
Its a representation for the cognitive level for each student. The representation is shown in a matrix. On the x-axis of the matrix are the students and on the y-axis the concept. The color of the points shows the performance.

Behavioural Aspects:
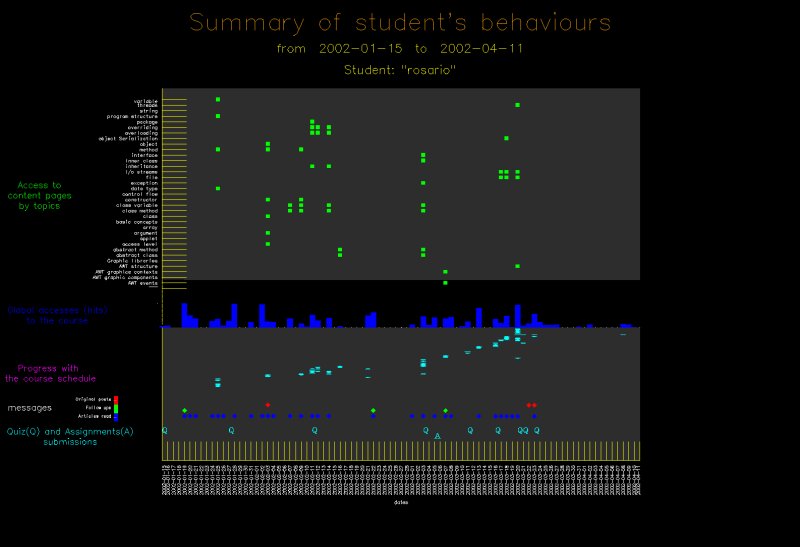
This graph is a representation of a students overall performance. It shows his/her accesses to the content, the global accesses, the progress with the course, messages at the discussion board and submissions to quizes and assignments.

Evaluation
[Mazza, 2006]
References
[Mazza and Dimitrova, 2004] Mazza, Ricardo; Dimitrova, Vania. Visualising student tracking data to support instructors in web-based distance education. In Proceedings of the 13th international World Wide Web conference on Alternate track papers