Data Visualization

Comparision between Information Visualization and Data Visualization
In this sense, information visualization takes us back to the earliest scratches of forms on rocks, to the development of pictoria as mnemonic devices in illuminated manuscripts, and to the earliest use of diagrams in the history of science and mathematics. But, as used today, the term information visualization is generally applied to the visual representation of large-scale collections of non-numerical information, such as files and lines of code in software systems, library and bibliographic databases, networks of relations on the internet, and so forth. In this document we avoid both the earliest, and most of the latest uses in this sense. Another present field, called scientific visualization, is also under-represented here, but for reasons of lack of expertise rather than interest. This area is primarily concerned with the visualization of 3-D+ phenomena (architectural, meterological, medical, biological, etc.), where the emphasis is on realistic renderings of volumes, surfaces, illumination sources, and so forth, perhaps with a dynamic (time) component.
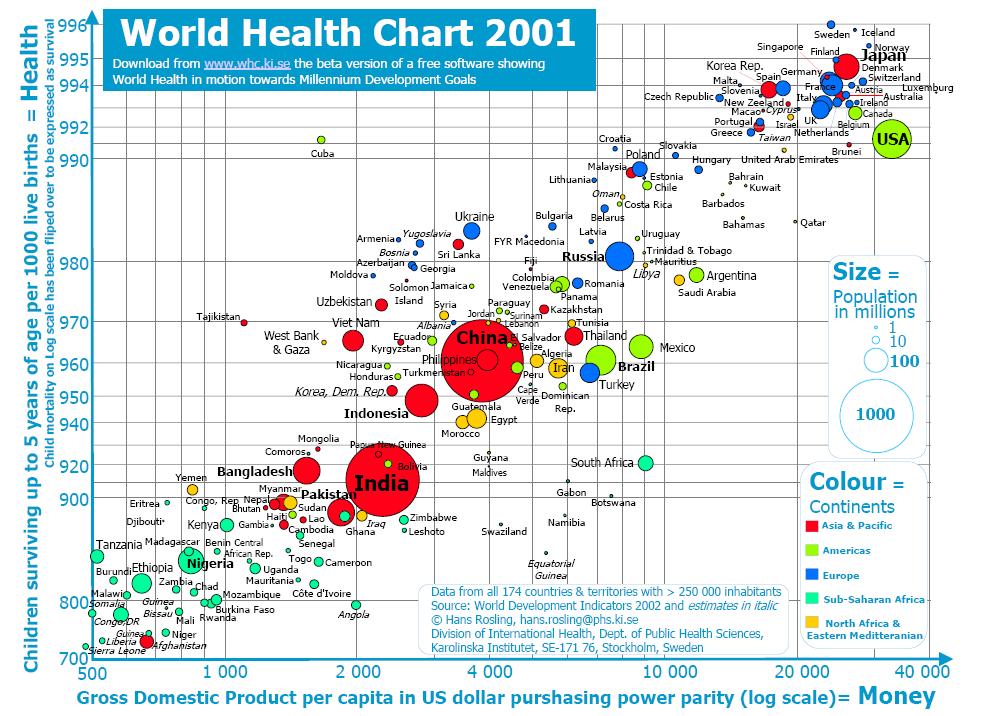
Instead, we focus on the slightly narrower domain of data visualization, the science of visual representation of "data", defined as information which has been abstracted in some schematic form, including attributes or variables for the units of information. This topic could be taken to subsume the two main focii: statistical graphics, and thematic cartography.
References
- [Bhargava, 2003]: Bharat Bhargava, Data Visualization Overview, 2003.
- [Friendly and Denis, 2004]: Michael Friendly and Daniel J. Denis, Milestones in the history of thematic cartography, statistical graphics, and data visualization, April 14, 2004. http://www.math.yorku.ca/SCS/Gallery/milestone/