Fisheye View
Article Summary of [Sarkar and Brown, 1993]:
Authors
- Sarkar, Manojit
- Brown, H. Marc
- Hyder, S
Short description
Graphs with hundreds of vertices and edges are common in many application areas of computer science. Displaying all this information on a screen has the disadvantage of loosing the details. Alternatively, zooming into a part of the graph does show local details but loses the overall structure of the graph. Displaying two views – one view of the entire graph and one of a zoomed portion of it – has the advantage of seeing both local detail and global structure but the drawback of requiring extra screen space and forcing the viewer to mentally integrate the views. A fisheye view of a graph shows an area of interest quite large while the rest of the graph remains smaller and in less detail. The viewer can position the mouse to the area of interest of the graph and determine the focus point in that way. As the mouse is dragged, the focus changes and the display is updated smoothly in real time. The appearance of the fisheye view can be varied by changing the distortion factor of the lens. With the distance from the focus and a number, which is assigned to each vertex to represent its relative importance (a priori importance (API)) in the global structure, the visual worth for each vertex is computed. By means of the parameter "visual worth cutoff" the depth of details displayed on the screen can be adjusted. [Sarkar and Brown, 1993]
Advantages and disadvantages using Fisheye View
Fisheye Lens is a tool for seeing both local detail and global context of a graph simultaneously. It is an intuitive spatial navigation and visualisation tool which clearly portrays immediate relationships between a node in focus and its neighbours. However, distortion or discontinuity between local detail and glbal context often cause confusion.
Suitable Datatypes
Graphs, particularly network topologies, VLSI circuits and graph theory.
Examples and use cases
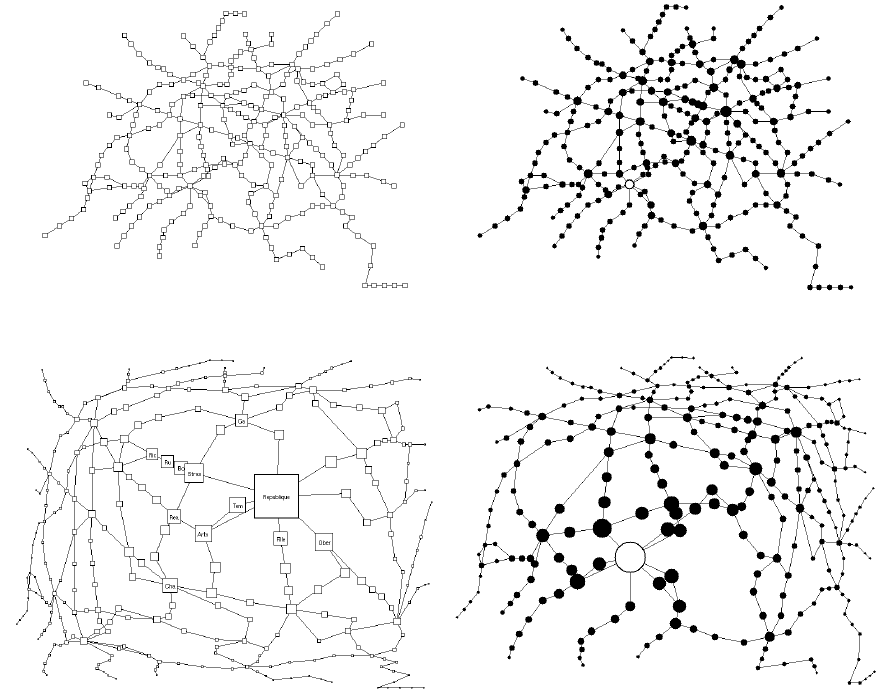
 The images represent the Metro system in Paris, whereat the upper left image is a normal view of the Metro. In all graphs, the a priori importance (API) assigned to each station is the number of connecting stations. In the upper right image, the sizes of vertices vary according to the API and the distortion parameter is zero. In the lower images, the distortion parameter is 2 and the area around the focus station is magnified and the vertices which are far away are shrunk. In the lower left image, the representation of the vertices is changed so that the names of the stations are shown, space permitting.
[Sarkar and Brown, 1993]
Evaluation
A Comparison of Fisheye Lenses for Interactive Layout Tasks
Demos
Fisheye Tree View - A Tree View Featuring Animation, Overview+Detail and Focus+Context
References
- [Sarkar and Brown, 1993] Sarkar Manojit, Brown H. Marc, Graphical fisheye views, Communications of the ACM 37 (12) (1994) 73 - 83, http://portal.acm.org/citation.cfm?coll=GUIDE&dl=GUIDE&id=198384, last visit: 24th of April 2006.
- [Tory and Möller, 2004] Melanie Tory and Torsten Möller, Human Factors in Visualization Research, IEEEE Transactions on Visualization and Computer Graphics, 10(1):72-84, January/February 2004.