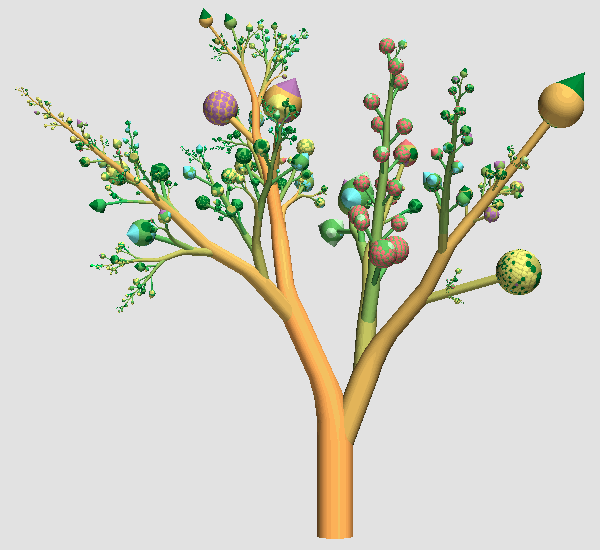
Information Visualization
Information visualization (InfoVis) produces (interactive) visual representations of abstract data to reinforce human cognition and perception; thus enabling the viewer to gain knowledge about the internal structure of the data and causal relationships in it.
Definitions
The use of computer-supported, interactive, visual representations of abstract data to amplify cognition.
[Card et al., 1998]
Overview
Application of information visualization on the computer involves providing means to transform and represent data in a form that allows and encourages human interaction. Data can therefore be analyzed by exploration rather than pure reasoning; users can develop understanding for structures and connections in the data by observing the immediate effects their interaction has upon the visualization.
Examples

Information visualization is applied in countless areas covering every industry and all tasks where understanding of the intrinsic structure in data is crucial.
Some prominent examples are:
- Economical/financial analysis
- Representation of large hierarchies
- Medical training/assistance
- Engineering/Physics
References
- [Card et al., 1998]: Card, S. and Mackinlay, J. and Shneiderman, B. Readings in Information Visualization: Using Vision to Think Morgan Kaufmann Publishers, 1998.
- [Voigt, 2002]: Robert Voigt, Classification and Definition of Terms, 2002.
External links
- http://www.math.yorku.ca/SCS/Gallery/ has a lot of (positive and negative) examples including historical milestones.