File:Proportion.gif: Difference between revisions
Jump to navigation
Jump to search
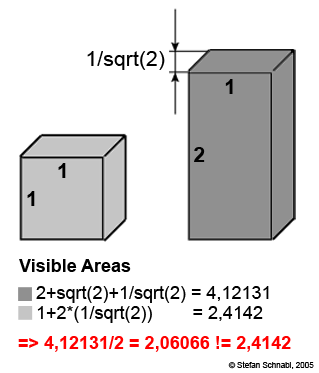
Giving an easy example why the actually visible areas in a 3D bar chart are not proportional to the represented values. |
|||
| Line 1: | Line 1: | ||
== Summary == | == Summary == | ||
Giving an easy example why the actually visible areas in a 3D bar chart are not proportional to the represented values. | Giving an easy example why the actually visible areas in a 3D bar chart are not proportional to the represented values. This relates to chart junk in terms of unnecessary area and to the lie factor as the proportion is wrong. | ||
== Copyright status == | == Copyright status == | ||
Stefan Schnabl, 2005 | Stefan Schnabl, 2005 | ||
== Source == | == Source == | ||
Stefan Schnabl, 2005 | Stefan Schnabl, 2005 | ||
Latest revision as of 16:02, 31 October 2005
Summary
Giving an easy example why the actually visible areas in a 3D bar chart are not proportional to the represented values. This relates to chart junk in terms of unnecessary area and to the lie factor as the proportion is wrong.
Copyright status
Stefan Schnabl, 2005
Source
Stefan Schnabl, 2005
File history
Click on a date/time to view the file as it appeared at that time.
| Date/Time | Thumbnail | Dimensions | User | Comment | |
|---|---|---|---|---|---|
| current | 20:38, 28 October 2005 |  | 319 × 373 (11 KB) | UE-InfoVis0506 0306110 (talk | contribs) | Giving an easy example why the actually visible areas in a 3D bar chart are not proportional to the represented values. |
You cannot overwrite this file.
File usage
There are no pages that use this file.