Chart Junk: Difference between revisions
No edit summary |
No edit summary |
||
| Line 11: | Line 11: | ||
==Key Words== | ==Key Words== | ||
Chart Junk, Bar Chart, Pie Chart | Chart Junk, Bar Chart, Pie Chart | ||
==Abstract== | |||
With modern technologies in the field of office work reporting and presenting got a major boost in the last few years. The everywhere available color beamer for presentations and easily accessible software has forced a tremendous rise in colorful and media enriched presentations throughout branches. | |||
Does more color and media always help to get the point of a message? Or is it mostly distracting the viewer from the spot of interest? This article wants to focus on what is called "Chart Junk" and defines the parts of presentations and reports that are not carrying essentail information, that are not even neutral, but which du disturb the visualization of the data. | |||
==What is Chart Junk?== | |||
| Line 30: | Line 37: | ||
* In addition, if you look at it in this way: [[Image:3Dbars03.jpg|30px|3D-bars]] the proportions of the areas are not correct! | * In addition, if you look at it in this way: [[Image:3Dbars03.jpg|30px|3D-bars]] the proportions of the areas are not correct! | ||
=== | ===Presentation=== | ||
The | The image below also gives a good idea what is meant by "Chart Junk". The Dollar signs are not at all helpful for the point of interest. This is the way the amount of money develops over the years. As the example shows, this is best presented by a simple line. | ||
<center> | <center> | ||
[[Image: | [[Image:Junk1.gif]] | ||
</center> | |||
==Conclusion== | ==Conclusion== | ||
Revision as of 19:38, 28 October 2005
Definition(s)
- Chartjunk is a term for unnecessary or confusing visual elements in charts and graphs. Markings and visual elements can be called chartjunk if they are not part of the minimum set of visuals necessary to communicate the information understandably. Examples of unnecessary elements which might be called chartjunk include heavy or dark grid lines, ornamented chart axes and display frames, pictures or icons within data graphs, and ornamental shading.
Another kind of chartjunk skews the depiction and makes it difficult to understand the real data being displayed. Examples of this type include items depicted out of scale to one another and noisy backgrounds making comparison between elements difficult in a chart or graph. [wikipedia.org]
- "The interior decoration of graphics generates a lot of ink which does not tell the viewer anything new. The purpose of the decoration varies - to make the graphic appear more scientific, to enliven the display, to give the designer an opportunity to exercise artistic skill. Regardless of the cause, it is all non-data-ink or redundant data-ink, and it is often chartjunk." [Tufte, 1983]
Key Words
Chart Junk, Bar Chart, Pie Chart
Abstract
With modern technologies in the field of office work reporting and presenting got a major boost in the last few years. The everywhere available color beamer for presentations and easily accessible software has forced a tremendous rise in colorful and media enriched presentations throughout branches. Does more color and media always help to get the point of a message? Or is it mostly distracting the viewer from the spot of interest? This article wants to focus on what is called "Chart Junk" and defines the parts of presentations and reports that are not carrying essentail information, that are not even neutral, but which du disturb the visualization of the data.
What is Chart Junk?
Examples
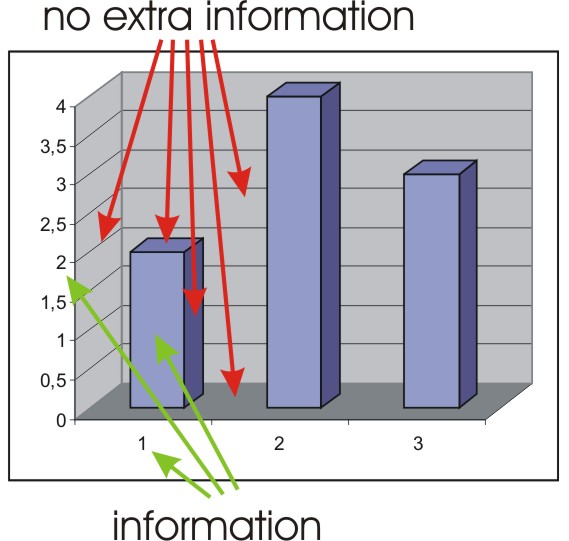
3D Bar Chart
- The Icon of the Microsoft® Office Excel "Diagramm-Assistent" shows exactly what it mostly produces namely Chart Junk.
Microsoft® Excel "Diagramm-Assistent"
Presentation
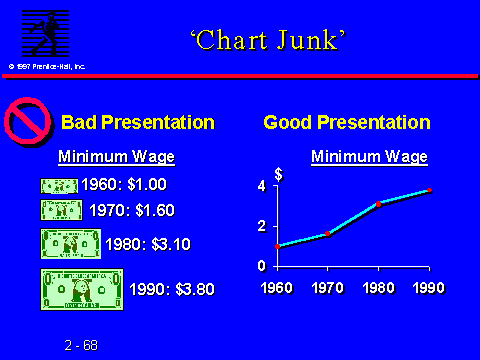
The image below also gives a good idea what is meant by "Chart Junk". The Dollar signs are not at all helpful for the point of interest. This is the way the amount of money develops over the years. As the example shows, this is best presented by a simple line.
Conclusion
Again, Edward R. Tufte:
"Kill the frills and get to the point!" [Tufte, 1997]
Bibliography
[wikipedia.org] Wikipedia, the free encyclopedia, http://en.wikipedia.org/wiki/Chartjunk
[Tufte, 1983]
Edward R. Tufte,
The Visual Display of Quantitative Information,
1983. Created at: June, 2004. Retrieved at: October 22, 2005
http://www.edwardtufte.com/tufte/
[Tufte, 1997]
Edward R. Tufte,
Visual Explanations,
Graphics Press,
1997. Created at: 1997, Retrieved at: October 22, 2005
http://www.edwardtufte.com/tufte/
[AHK]
AHK Die deutschen Auslandshandelskammern in Mercosur. Retrieved at: October 22, 2005
http://www.mercosur-info.com/al/handelsstatistiken.shtml
<< G8
<<< overview

