Data Visualization: Difference between revisions
Jump to navigation
Jump to search
No edit summary |
No edit summary |
||
| Line 1: | Line 1: | ||
{{Definition|'''Data visualization''' is the process of using graphical presentation to represent complex data in a way that provides the viewer with a qualitative understanding of its information contents, turning complicated sets of data into visual insights.[Bhargava, 2003]}} | {{Definition|'''Data visualization''' is the process of using graphical presentation to represent complex data in a way that provides the viewer with a qualitative understanding of its information contents, turning complicated sets of data into visual insights.[Bhargava, 2003]}} | ||
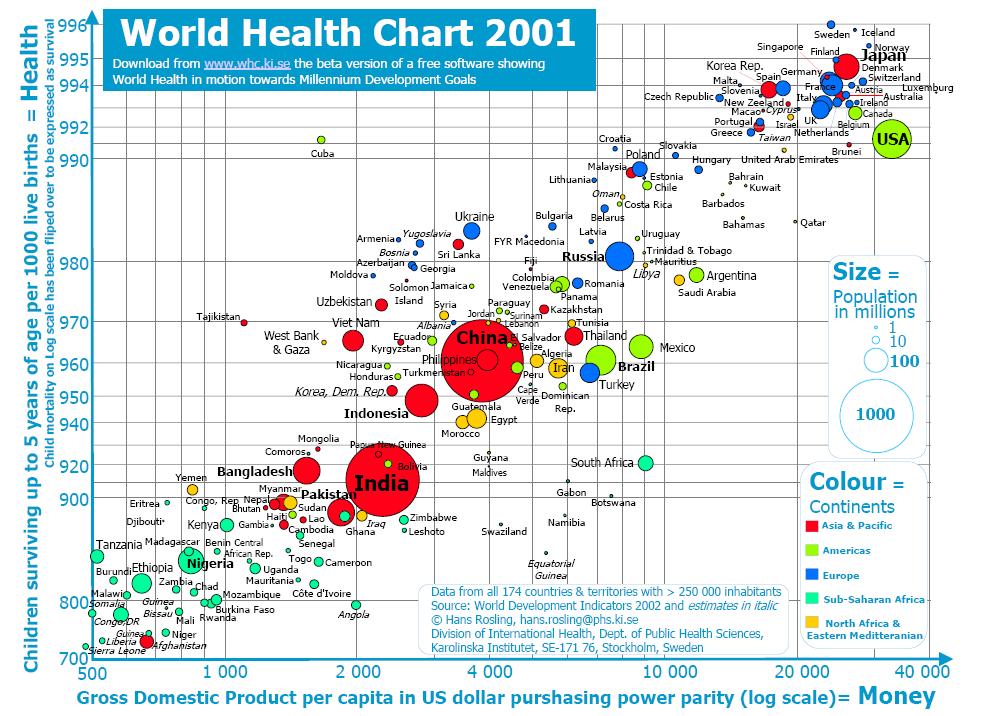
[[Image:datavis.jpg|left|Complex example of data visualization]] | [[Image:datavis.jpg|100px|left|Complex example of data visualization]] | ||
By presenting data in a way that suits human perception, data visualization becomes the essential tool for [[exploratory data analysis]]. | By presenting data in a way that suits human perception, data visualization becomes the essential tool for [[exploratory data analysis]]. | ||
Revision as of 01:01, 3 June 2005
Data visualization is the process of using graphical presentation to represent complex data in a way that provides the viewer with a qualitative understanding of its information contents, turning complicated sets of data into visual insights.[Bhargava, 2003]

By presenting data in a way that suits human perception, data visualization becomes the essential tool for exploratory data analysis.
... the science of visual representation of “data”, defined as information which has been abstracted in some schematic form, including attributes or variables for the units of information.
[Friendly and Denis, 2004]
References
- [Bhargava, 2003]: Bharat Bhargava, Data Visualization Overview, 2003.
- Friendly and Denis, 2004: Michael Friendly and Daniel J. Denis, Milestones in the history of thematic cartography, statistical graphics, and data visualization, 14.April 2004.