Teaching:TUW - UE InfoVis WS 2007/08 - Gruppe 01 - Aufgabe 1 - Drag and Drop: Difference between revisions
No edit summary |
(Image eingefügt) |
||
| Line 1: | Line 1: | ||
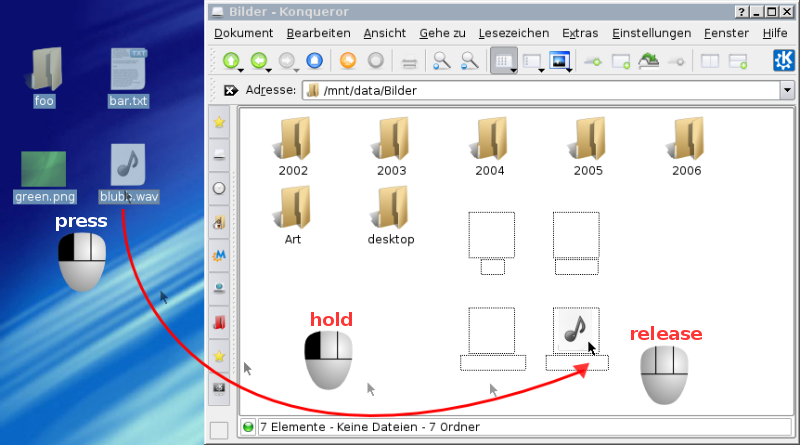
In computer graphical user interfaces, drag-and-drop is the action of (or support for the action of) clicking on a virtual object and dragging it to a different location or onto another virtual object. In general, it can be used to invoke many kinds of actions, or create various types of associations between two abstract objects [Wikipedia, 2009]. | In computer graphical user interfaces, drag-and-drop is the action of (or support for the action of) clicking on a virtual object and dragging it to a different location or onto another virtual object. In general, it can be used to invoke many kinds of actions, or create various types of associations between two abstract objects [Wikipedia, 2009]. | ||
[[Image:800px-Drag-and-drop-en.svg.png|150px|thumb|Dragging an image and dropping it on the Browser icon]] | |||
==History== | ==History== | ||
Revision as of 17:33, 6 November 2009
In computer graphical user interfaces, drag-and-drop is the action of (or support for the action of) clicking on a virtual object and dragging it to a different location or onto another virtual object. In general, it can be used to invoke many kinds of actions, or create various types of associations between two abstract objects [Wikipedia, 2009].
History
The first drag & drop implementation for Windows was a shareware program called Aporia by Jeffrey Greenberg in 1988 under Windows 2.0, and later commercialized as WinTools. This program elaborated the single icon on the Macintosh that supported drag & drop, the trash icon. In Aporia/WinTools all icons had functions that could be obtained by double clicking the left mouse button, by clicking on the right mouse button, or by dragging onto one of several functional icons, such as printing, copying, viewing, and other actions. If an icon was double-clicked on and ran a program, the icon changed to indicate that a program was running, and if it was then dragged to the trash, the program was exited.
Subsequently numerous other competitors provided drag & drop desktop replacements to the standard Windows interface including the Norton Desktop, Xerox, NewWave, and Central Point. In Windows 95, Microsoft prevented developers from taking over the desktop and released a drag & drop model of their own.
Technical Overview
A drag and drop transaction consists of the following actions:
- A user presses and holds BTransfer, usually mouse button 2, over a source object starting a drag transaction. The application owning that object is the initiator of the drag. The current pointer is replaced by a drag icon-a picture representing the item being dragged.
- The user moves the pointer. From now until a drop occurs, the drag icon replaces the mouse pointer.
- The user drops the object, usually by releasing the mouse button.
Locations on the screen that can accept drops are drop sites, and the application owning that drop site is the destination or receiver.
The drag icon can be dropped anywhere on the screen. However, only certain widgets have registered themselves as drop sites and are able to process the drop.
The receiver application usually performs some action on the information represented by the dragged icon. The initiator application may also perform some action based on the results of a drag transaction.
A drop can be between applications or within the same application. An application can be both source and destination of a drop, source only, destination only, or not participate in drag and drop at all.
The user can request help about a drop site, if available, by dragging to the drop site, and pressing KHelp (usually F1).
The user can cancel the drag at any time by pressing KCancel, usually Escape. [The Santa Cruz Operation, 1996]
Drag & Drop in Information Visualization
Use in Common Applications
The most common uses of Drag and Drop are
- changing the point of view in visualisation data
For example:- An application where you can see an overview of a map: by draging on the map and moving around you change the view position. By releasing the button the new view on the data and in most cases completely different to the output before.
- order visualisation data
For Example:- Picture Application where you order the sequenz of a slide show
- When you are cleaning up your Desktop by draging folders around
Command Post of the Future (CPOF)
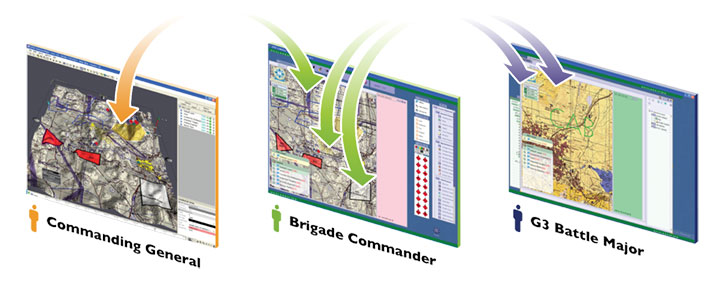
The United States Army's Command Post of the Future (CPOF) is a C2 software system that allows commanders to maintain topsight over the battlefield; collaborate with superiors, peers and subordinates over live data; and communicate their intent.
All visual elements in CPOF are interactive via drag-and-drop gestures. Users can drag data-elements and annotation from any visualization framework into any other (i.e., from a chart to a table), which reveal different data-attributes in context depending on the visualization used. Most data-elements can be grouped and nested via drag-and-drop to form associations that remain with the data in all of its views.Drag-and-drop composition on live visualizations is CPOF's primary mechanism for editing data values, such as locations on a map or tasks on a schedule (for example, moving an event-icon on a map changes the lat/lon values of that event in the shared repository; moving a task icon on a schedule changes its time-based values in the shared repository). The results of editing gestures are conveyed in real-time to all observers and users of a visualization; when one user moves an event on a map, for example, that event-icon moves on all maps and shared views, such that all users see its new location immediately. Data inputs from warfighters are conveyed to all collaborators as the "natural" result of a drop-gesture in-situ, requiring no explicit publishing mechanism.
A Drag-and-Drop Strategy for Labeling Photos
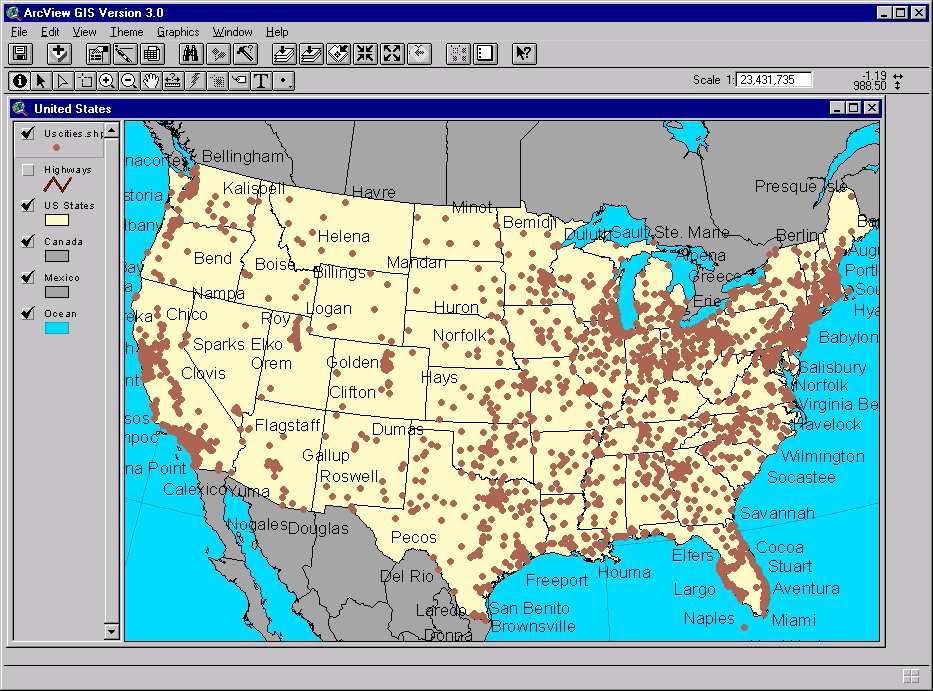
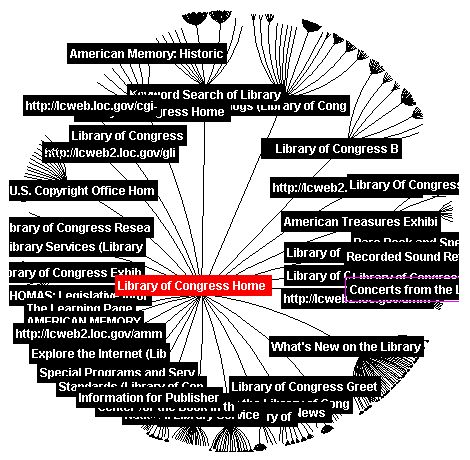
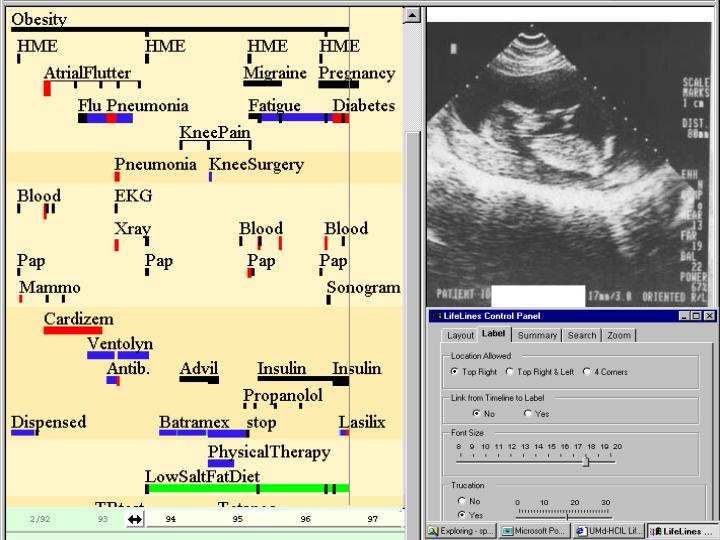
Annotation of photos is a variation on previously explored problems such as annotation on maps in which the challenge is to place city, state, river, or lake labels close to the features. There is a long history of work on this problem, but new possibilities emerge because of the dynamics of the computer screen (Figure 1). However, annotation is usually seen as an authoring process conducted by specialists and users only chose whether to show or hide annotations. Variations on annotation also come from the placement of labels on markers in information visualization tasks such as in tree structures, such in the hyperbolic tree (Figure 2) or in medical histories, such as LifeLines (Figure 3).
Previous work on annotation focused on writing programs to make label placements that reduced overlaps, but there are many situations in which it is helpful for users to place labels manually, much like post-it notes, on documents, photos, maps, diagrams, webpages, etc. Annotation of paper and electronic documents by hand is also a much-studied topic with continuing innovations. While many systems allow notes to be placed on a document or object, the demands of annotating personal photo libraries are worthy of special study. We believe that personal photo libraries are a special case because users are concentrating on the photos (and may have a low interested in the underlying technology), are concerned about the social aspects of sharing photos, and are intermittent users. They seek enjoyment and have little patience for form filling or data entry. [Shneiderman and Kang, 2000]
Lookmark
A 2.5D Web Information Visualization System
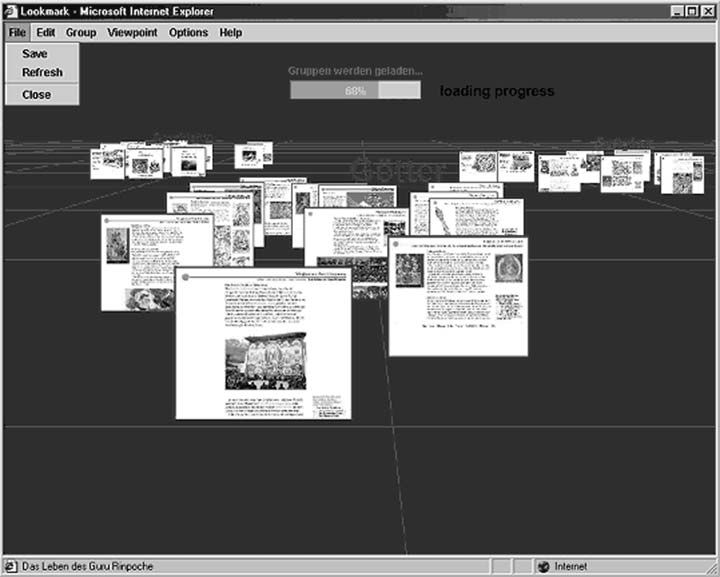
Lookmarks are thumbnails of existing web pages that can be arranged within a 2.5-dimensional space, just like documents can be arranged on a normal desk. The Lookmark system offers the user the opportunity of taking individual web pages and structuring and managing them within a 2.5-dimensional space. In Lookmark both standard devices, mouse and keyboard, can be used. Mouse handling is limited to single click, double click and drag-and-drop. The meaning of mouse events depends on the context of the object that receives the event:
- Thumbnails. With a single mouse click one can add resp. delete the clicked thumbnail to resp. from the current selection. At the same time the name of the corresponding web page is displayed in the status bar of the user interface. By double clicking on a specific thumbnail, one can open the corresponding web page in the associated Web-browser. By using drag-and-drop one can move a thumbnail along the horizontal and depth dimension (X- and Z-axis).
- Groups of thumbnails. Thumbnails in a group are handled like single thumbnails. Groups of thumbnails can be moved simultaneously by dragging the group label.
- Selections. Dragging a thumbnail of a selection moves all selected thumbnails. A selection can be dissolved by clicking somewhere in the manipulation panel. [Breiteneder et al., 2002]
References
[Wikipedia: Drag-and-drop] Drag-and-drop, Wikipedia, 6 November 2007,http://en.wikipedia.org/wiki/Drag_and_drop
[The Santa Cruz Operation, 1996] The Santa Cruz Operation, 1994-1996. Motif Programmer's Guide. http://www.s-and-b.ru/syshlp/motif_guide/MotifProgGuide/TOC.html
[Wikipedia: Command Post of the Future] The United States Army's Command Post of the Future (CPOF), Wikipedia, 20 July 2007, http://en.wikipedia.org/wiki/Command_Post_of_the_Future
[General Dynamics C4 System] General Dynamics C4 Systems, 2007,http://www.gdc4s.com/content/detail.cfm?item=2a58f8e2-ef2b-4bb1-9251-42ee4961dd7f
[Shneiderman and Kang, 2000] Ben Shneiderman, Hyunmo Kang Dept. of Computer Science, Human-Computer Interaction Laboratory, Institute for Advanced Computer Studies & Institute for Systems Research University of Maryland. A Drag-and-Drop Strategy for Labeling Photos, Created at: 2000. Retrieved at: November 3, 2009. https://drum.umd.edu/dspace/bitstream/1903/1068/2/CS-TR-4129.pdf
[Breiteneder et al., 2002] Christian Breiteneder, Horst Eidenberger, Geert Fiedler and Markus Raab. Vienna University of Technology, Institute of Software Technology and Interactive Systems. A 2.5D Web Information Visualization System. Created at: July 24, 2002. Retrieved at: November 3, 2009. http://www.ims.tuwien.ac.at/media/documents/publications/eurasia2002.pdf