CourseVis: Difference between revisions
Jump to navigation
Jump to search
No edit summary |
No edit summary |
||
| Line 8: | Line 8: | ||
== Suitable Datatypes == | == Suitable Datatypes == | ||
This method can be used for tracking data generated by course management systems (CMS). Currently, the only supported CMS is [http://www.webct.com/ WebCT]. | |||
== Figures == | == Figures == | ||
Revision as of 10:02, 26 April 2007
Authors
Short Description
[...]a novel approach of using web log data generated by course management systems (CMS) to help instructors become aware of what is happening in distance learning classes. Specifically, techniques from Information Visualization are used to graphically render complex, multidimensional student tracking data collected by CMS.
[Mazza and Dimitrova, 2007]
Suitable Datatypes
This method can be used for tracking data generated by course management systems (CMS). Currently, the only supported CMS is WebCT.
Figures
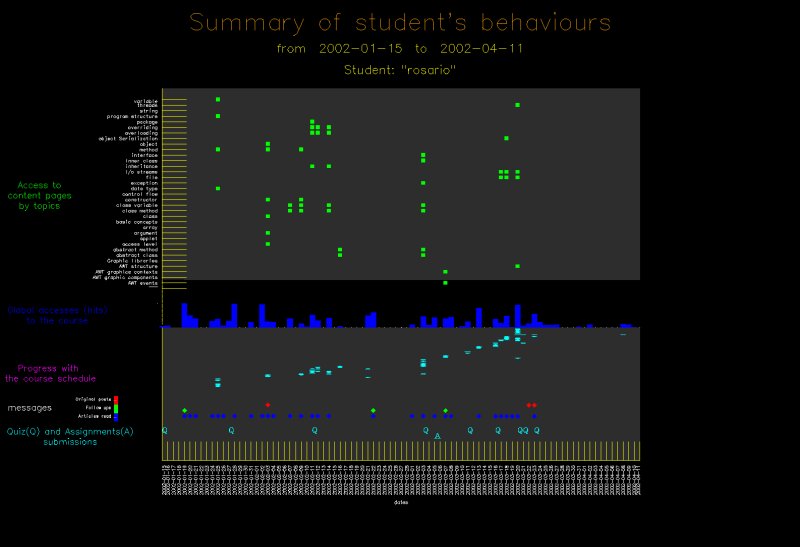
Behavioural Aspects:
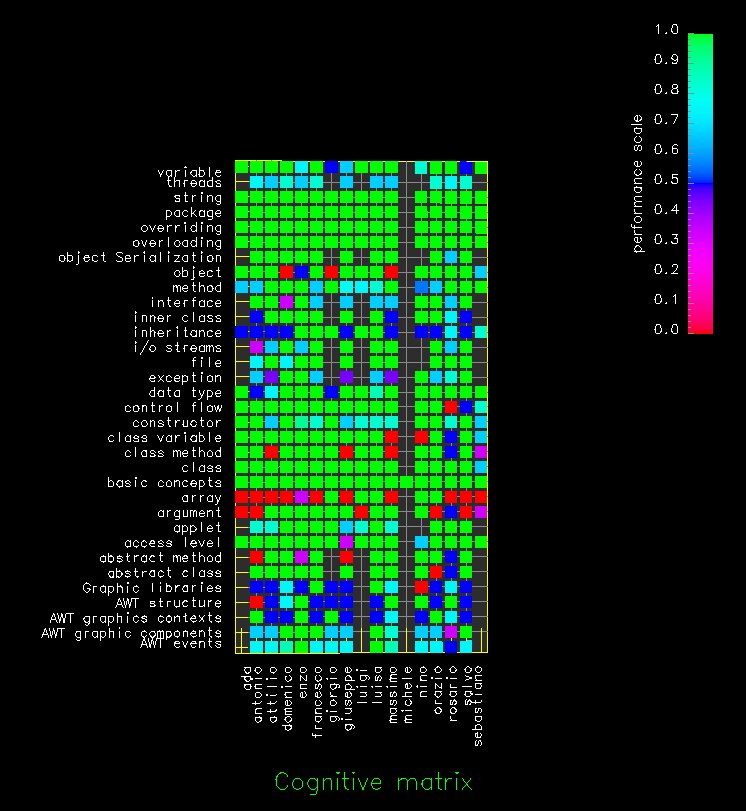
Cognitive Aspects:
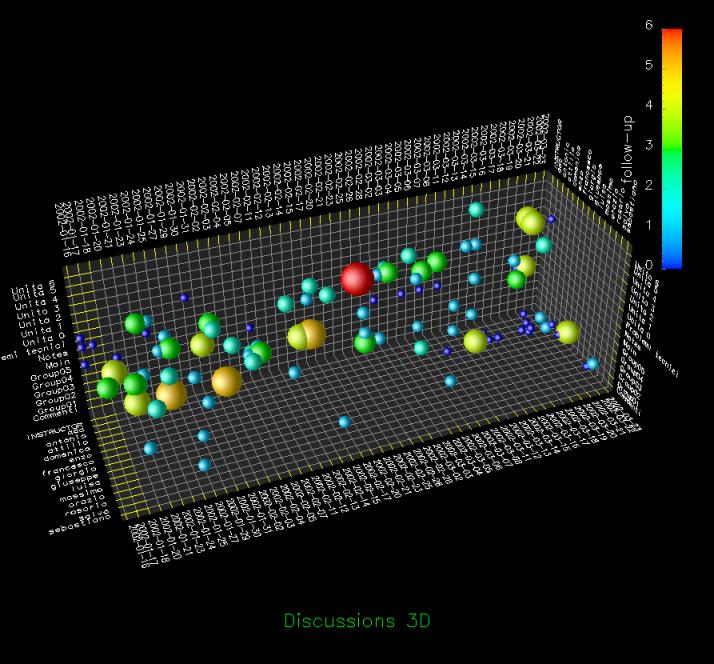
Social Aspects:
Evaluation
References
[Mazza and Dimitrova, 2007] Mazza, Ricardo; Dimitrova, Vania. CourseVis: A graphical student monitoring tool for supporting instructors in web-based distance courses. International Journal of Human Computer Studies, Vol. 65, pp. 125-139. 2007.


