Circle Packing: Difference between revisions
Jump to navigation
Jump to search
No edit summary |
No edit summary |
||
| Line 7: | Line 7: | ||
== Short description == | == Short description == | ||
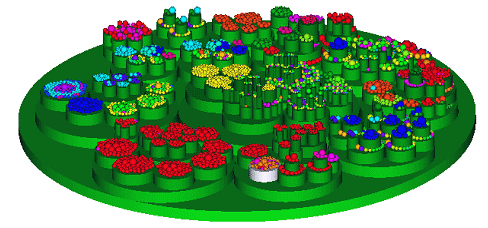
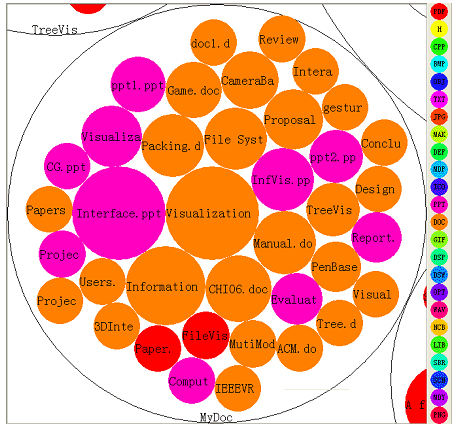
{{Quotation|Circle packing is a method to visualize large hierarchical data using nested circles. Inspired by treemaps and Grokker, Wang et al. developed a layout algorithm for tree structures which gives a good overview for large data sets. Tangent circles represent the brother nodes at the same level. The different leves are shown by nested circles (2D) or nested cylinders (3D). An advantage of this algorithm is the good overview for large data sets and it is easy to make out groupings and structural relationships.| [ | {{Quotation|Circle packing is a method to visualize large hierarchical data using nested circles. Inspired by treemaps and Grokker, Wang et al. developed a layout algorithm for tree structures which gives a good overview for large data sets. Tangent circles represent the brother nodes at the same level. The different leves are shown by nested circles (2D) or nested cylinders (3D). An advantage of this algorithm is the good overview for large data sets and it is easy to make out groupings and structural relationships.| [Wang, W. et al., 2006]}} | ||
| Line 13: | Line 13: | ||
[[Image:Nodes.jpg]] <br/> | [[Image:Nodes.jpg]] <br/> | ||
[[Image:3d_example.gif]] <br/> | [[Image:3d_example.gif]] <br/> | ||
[[Image:detail_example.gif]] <br/> | [[Image:detail_example.gif]] <br/> | ||
Revision as of 20:59, 23 April 2007
Authors
- Hongan Wang
- Guozhong Dai
- Weixin Wang
- Hui Wang
Short description
Circle packing is a method to visualize large hierarchical data using nested circles. Inspired by treemaps and Grokker, Wang et al. developed a layout algorithm for tree structures which gives a good overview for large data sets. Tangent circles represent the brother nodes at the same level. The different leves are shown by nested circles (2D) or nested cylinders (3D). An advantage of this algorithm is the good overview for large data sets and it is easy to make out groupings and structural relationships.
[Wang, W. et al., 2006]
figures
Suitable Datatypes
Example and use cases
Dynamic queries allow users to formulate queries by adjusting graphical widgets, such as slider, and see the results immediately. By providing a graphical visualization of the database and search results. Users can easliy change the parameters for search. The interfaces were used to explore a real-estate database and find homes meeting specific search criteria.
Internal Links
References
- [ACM, 1992] ACM, I ACM Press New York, http://portal.acm.org/citation.cfm?id=1124851&coll=GUIDE&dl=GUIDE&CFID=20762537&CFTOKEN=32865372


