Teaching:TUW - UE InfoVis WS 2006/07 - Gruppe 03 - Aufgabe 2: Difference between revisions
Jump to navigation
Jump to search
(Aufgabenstellung) |
|||
| Line 2: | Line 2: | ||
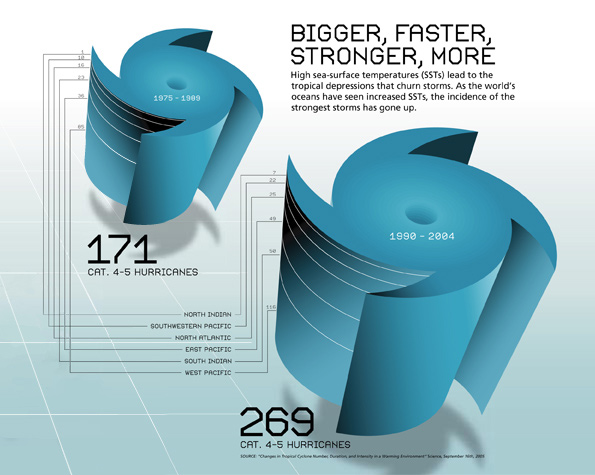
[[Image:Seed06storms.jpg|none|thumb|600px|none|State of the Planet - Bigger, Faster, Stronger, More]] | [[Image:Seed06storms.jpg|none|thumb|600px|none|State of the Planet - Bigger, Faster, Stronger, More]] | ||
==Arguments why it is a poor graphic== | |||
*Principles of Graphical Integrity | |||
lie factor | |||
Clear, detailed, and thorough labeling should be used.(the numbers are not readable and the lines between the numbers are not needed and very irritating. | |||
The number of information-carrying (variable) dimensions depicted should not exceed the number of dimensions in the data.(a pseudo 3-dimensional graphic is used to show 1-dimensional data. | |||
*data-ink ratio | |||
*visual clutter | |||
*Data Density | |||
*Chartjunk | |||
Revision as of 21:50, 8 November 2006
Poor Graphic

Arguments why it is a poor graphic
- Principles of Graphical Integrity
lie factor Clear, detailed, and thorough labeling should be used.(the numbers are not readable and the lines between the numbers are not needed and very irritating. The number of information-carrying (variable) dimensions depicted should not exceed the number of dimensions in the data.(a pseudo 3-dimensional graphic is used to show 1-dimensional data.
- data-ink ratio
- visual clutter
- Data Density
- Chartjunk