Tufte, Edward: Difference between revisions
Jump to navigation
Jump to search
mNo edit summary |
add 2 more books |
||
| (8 intermediate revisions by 2 users not shown) | |||
| Line 14: | Line 14: | ||
Books | Books | ||
*[Tufte E.R.: Envisioning Information | *[[Tufte, E.R.: The Visual Display of Quantitative Information, Graphics Press, 1983]] | ||
*[[Tufte, E.R.: Envisioning Information, Graphics Press, 1990]] | |||
*[[Tufte, E.R.: Visual Explanations, Graphics Press, 1997]] | |||
*[[Tufte, E.R.: Beautiful Evidence, Graphics Press, 2006]] | |||
[[Category:Persons]] | [[Category:Persons]] | ||
Latest revision as of 10:11, 5 November 2008

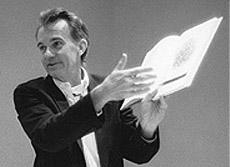
Edward Rolf Tufte (born in 1940) is a professor of statistics, graphic design, and political economy at Yale University and an expert in the presentation of informational graphics, such as infographics, charts and graphs.
He is a fellow of the American Statistical Association and has held fellowships from the Guggenheim Foundation and the Center for Advanced Studies in Behavioral Sciences.
Dealing with information visualization Edward Tufte has one main idea: Show as much data as possible with as little ornamentation as possible. Let the data speak for itself. He lays out some design principles:
- Above all else, show the data
- Maximize the data-to-ink ratio
- Erase non-data-ink
- Erase redundant data-ink
- Revise and edit
Books
- Tufte, E.R.: The Visual Display of Quantitative Information, Graphics Press, 1983
- Tufte, E.R.: Envisioning Information, Graphics Press, 1990
- Tufte, E.R.: Visual Explanations, Graphics Press, 1997
- Tufte, E.R.: Beautiful Evidence, Graphics Press, 2006