File:ScatterplotKeyvariables.png: Difference between revisions
Jump to navigation
Jump to search
The scatterplots show the change of monitored JMP-variables during the time 1990-2008. |
(No difference)
|
Latest revision as of 18:01, 17 January 2011
Summary
The scatterplots show the change of monitored JMP-variables during the time 1990-2008.
Copyright status
Source
The data for this task is provided by the Joint Monitoring Program for Water Supply and Sanitation (JMP) of the World Health Organization (WHO) and the UN Children’s Fund (UNICEF). http://www.wssinfo.org/data-estimates/table/
File history
Click on a date/time to view the file as it appeared at that time.
| Date/Time | Thumbnail | Dimensions | User | Comment | |
|---|---|---|---|---|---|
| current | 18:01, 17 January 2011 | 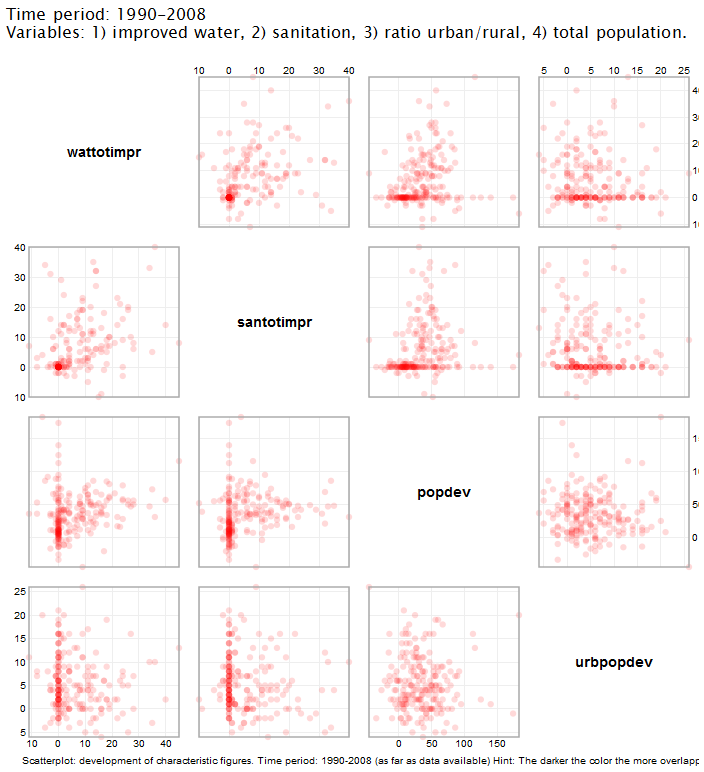 | 704 × 772 (105 KB) | UE-InfoVis1011 0326062 (talk | contribs) | The scatterplots show the change of monitored JMP-variables during the time 1990-2008. |
You cannot overwrite this file.
File usage
There are no pages that use this file.