Lie Factor: Difference between revisions
Created and uploaded a new image for the calculation in example 1 (the previous formula was incorrect: upside down and with incorrect value) |
|||
| (24 intermediate revisions by 4 users not shown) | |||
| Line 1: | Line 1: | ||
== | === Definition === | ||
The “Lie Factor” is a value to describe the relation between the size of effect shown in a graphic and the size of effect shown in the data. | The “Lie Factor” is a value to describe the relation between the size of effect shown in a graphic and the size of effect shown in the data. | ||
| Line 7: | Line 5: | ||
Edward Tufte, Prof. at the Yale University, defined the “Lie Factor” in his book “The Visual Display of Quantitative Information” in 1983. | Edward Tufte, Prof. at the Yale University, defined the “Lie Factor” in his book “The Visual Display of Quantitative Information” in 1983. | ||
He states the principle that | He states the principle that | ||
{{Quotation|The representation of numbers, as physically measured on the surface of the graphic itself, should be directly proportional to the quantities represented.|[Tufte, 1991]}} | |||
This results in the following formula: | |||
[[Image:lie_factor_formel.jpg|Formula for calculating the Lie Factor]] | [[Image:lie_factor_formel.jpg|Formula for calculating the Lie Factor]] | ||
| Line 19: | Line 18: | ||
In other words, the Lie Factor is ''“the size of an effect shown in a graph divided by the actual size of the effect in the data on which the graph is based”. [Craven, 2001] | In other words, the Lie Factor is ''“the size of an effect shown in a graph divided by the actual size of the effect in the data on which the graph is based”.'' [Craven, 2001] | ||
===Description=== | |||
To ensure the Integrity of a graphic, its Lie Factor should have a value between 0.95 and 1.05. If the value is less or greater, it indicates a substantial (and often intended) distortion, far beyond minor inaccuracies (e.g. caused by plotting). | To ensure the Integrity of a graphic, its Lie Factor should have a value between 0.95 and 1.05. If the value is less or greater, it indicates a substantial (and often intended) distortion, far beyond minor inaccuracies (e.g. caused by plotting). | ||
| Line 26: | Line 27: | ||
Is the Lie Factor greater than 1, the concerned graphic is so called “Overstating”. Is it less than 1, the graphic is “Understating”. | Is the Lie Factor greater than 1, the concerned graphic is so called “Overstating”. Is it less than 1, the graphic is “Understating”. | ||
---- | |||
This | ==Examples:== | ||
===Example 1:=== | |||
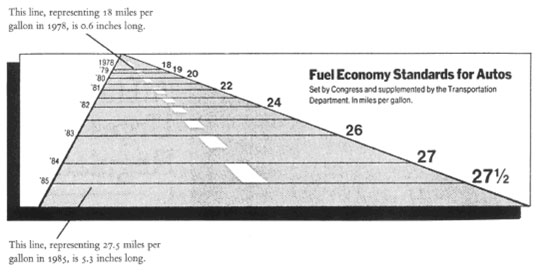
This graphic was originally published by the NY Times. It tries to show the mandated fuel economy standards for autos set by the US Department of Transportation. [Friendly, 2005] | |||
[[Image:lie_factor_example1_image.jpg|Example1 for the Lie Factor]] | [[Image:lie_factor_example1_image.jpg|Example1 for the Lie Factor]] | ||
::::::::::::::::::: | :::::::::::::::::::[Tufte, 1991] | ||
The standard required an increase in mileage from 18 to 27.5, an increase of 53%. The magnitude of increase shown in the graph is 783%, which results in a lie factor of 14.8! | ''The standard required an increase in mileage from 18 to 27.5, an increase of 53%. The magnitude of increase shown in the graph is 783%, which results in a lie factor of 14.8!'' [Friendly, 2005] | ||
The following formula shows the exact calculation: | The following formula shows the exact calculation: | ||
[[Image: | [[Image:Lie_factor.png|Example1 for the Lie Factor]] | ||
===Example 2:=== | |||
[[Image:lie_factor_example2.jpg|Example2 for the Lie Factor]] | [[Image:lie_factor_example2.jpg|Example2 for the Lie Factor]] | ||
:::::::: | ::::::::[Tufte, 1991] | ||
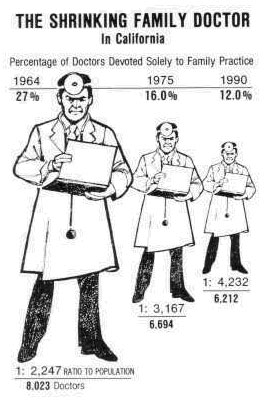
An important point for producing informative graphs, is the avoidance of ''confounding design variation with data variation'' [Friendly, 2005]. In other words, ''the scale of the graphic should always correspond to changes in the data being represented'' [Friendly, 2005]. The graph shown in this example breaks that rule ''by using area to show one-dimensional data, giving a lie factor = 2.8'' [Friendly, 2005]. | |||
---- | |||
==References:== | |||
[Craven, 2001a] Tim Craven, LIS 504 - Terms with definitions, Faculty of Information and Media Studies at the University of Western Ontario, Last updated: October 1, 2001, Retrieved at: October 24, 2005, http://instruct.uwo.ca/fim-lis/504/504ter.htm#l | |||
[Galliat, 2005] Tobias Galliat , Visualisierung von Informationsräumen, Fachhochschule Köln, University of Applied Sciences Cologne, Created at: March 30, 2005, Retrieved at: October 24, 2005, http://www.fbi.fh-koeln.de/institut/personen/galliat/Material/ss05/Visualisierung_von_Informationsraeumen_V2_2005.pdf | |||
[Tufte, 1991] Edward Tufte, The Visual Display of Quantitative Information, Second Edition, Graphics Press, USA, 1991, p. 57 – 69. | |||
[ | [Mueller, 2005] Klaus Mueller, Introduction to Visualization, Computer Science Department, Stony Brook University, Created at: September 6, 2003, Retrieved at: October 24, 2005, http://www.cs.sunysb.edu/~mueller/teaching/cse332/tufte.pdf | ||
[ | [Ihaka, 2003] Ross Ihaka, Good and Bad Graphs, Department of Statistics, University of Auckland, Created at: October 16, 2003, Retrieved at: October 24, 2005, http://www.stat.auckland.ac.nz/~ihaka/120/Lectures/lecture03-8up.pdf | ||
[ | [Kwc Blog, 2003] Kwc Blog, About Book: Visual Display of Quantitative Information, Created at: May 28, 2003, Retrieved at: October 24, 2005, http://kwc.org/blog/archives/2003/2003-05-28.book_visual_display_of_quantitative_information.html | ||
[ | [Craven, 2001b] Tim Craven, LIS 504 - Graphic displays of data, Faculty of Information and Media Studies at the University of Western Ontario, Last updated: November 6, 2000, Retrieved at: October 24, 2005, http://instruct.uwo.ca/fim-lis/504/504gra.htm | ||
[ | [Friendly, 2005] Michael Friendly, The Lie Factor, Department of Mathematics and Statistics, Toronto, Last updated: February 23, 2002, Retrieved at: October 24, 2005, http://www.math.yorku.ca/SCS/Gallery/lie-factor.html | ||
[ | [[Category:Glossary]] | ||
Latest revision as of 11:10, 12 April 2010
Definition
The “Lie Factor” is a value to describe the relation between the size of effect shown in a graphic and the size of effect shown in the data.
Edward Tufte, Prof. at the Yale University, defined the “Lie Factor” in his book “The Visual Display of Quantitative Information” in 1983.
He states the principle that
This results in the following formula:
where
In other words, the Lie Factor is “the size of an effect shown in a graph divided by the actual size of the effect in the data on which the graph is based”. [Craven, 2001]
Description
To ensure the Integrity of a graphic, its Lie Factor should have a value between 0.95 and 1.05. If the value is less or greater, it indicates a substantial (and often intended) distortion, far beyond minor inaccuracies (e.g. caused by plotting).
For example, if the lie factor had the value 1.02, then the graphic would not be described as a “lying” one, since a jitter in the graphic or another minor error is more likely the cause for the given distortion. On the other hand, if the factor had the value 1.45, we can generally assume that the producer intentionally distorted the graphic. Is the Lie Factor greater than 1, the concerned graphic is so called “Overstating”. Is it less than 1, the graphic is “Understating”.
Examples:
Example 1:
This graphic was originally published by the NY Times. It tries to show the mandated fuel economy standards for autos set by the US Department of Transportation. [Friendly, 2005]
- [Tufte, 1991]
The standard required an increase in mileage from 18 to 27.5, an increase of 53%. The magnitude of increase shown in the graph is 783%, which results in a lie factor of 14.8! [Friendly, 2005]
The following formula shows the exact calculation:
Example 2:
- [Tufte, 1991]
An important point for producing informative graphs, is the avoidance of confounding design variation with data variation [Friendly, 2005]. In other words, the scale of the graphic should always correspond to changes in the data being represented [Friendly, 2005]. The graph shown in this example breaks that rule by using area to show one-dimensional data, giving a lie factor = 2.8 [Friendly, 2005].
References:
[Craven, 2001a] Tim Craven, LIS 504 - Terms with definitions, Faculty of Information and Media Studies at the University of Western Ontario, Last updated: October 1, 2001, Retrieved at: October 24, 2005, http://instruct.uwo.ca/fim-lis/504/504ter.htm#l
[Galliat, 2005] Tobias Galliat , Visualisierung von Informationsräumen, Fachhochschule Köln, University of Applied Sciences Cologne, Created at: March 30, 2005, Retrieved at: October 24, 2005, http://www.fbi.fh-koeln.de/institut/personen/galliat/Material/ss05/Visualisierung_von_Informationsraeumen_V2_2005.pdf
[Tufte, 1991] Edward Tufte, The Visual Display of Quantitative Information, Second Edition, Graphics Press, USA, 1991, p. 57 – 69.
[Mueller, 2005] Klaus Mueller, Introduction to Visualization, Computer Science Department, Stony Brook University, Created at: September 6, 2003, Retrieved at: October 24, 2005, http://www.cs.sunysb.edu/~mueller/teaching/cse332/tufte.pdf
[Ihaka, 2003] Ross Ihaka, Good and Bad Graphs, Department of Statistics, University of Auckland, Created at: October 16, 2003, Retrieved at: October 24, 2005, http://www.stat.auckland.ac.nz/~ihaka/120/Lectures/lecture03-8up.pdf
[Kwc Blog, 2003] Kwc Blog, About Book: Visual Display of Quantitative Information, Created at: May 28, 2003, Retrieved at: October 24, 2005, http://kwc.org/blog/archives/2003/2003-05-28.book_visual_display_of_quantitative_information.html
[Craven, 2001b] Tim Craven, LIS 504 - Graphic displays of data, Faculty of Information and Media Studies at the University of Western Ontario, Last updated: November 6, 2000, Retrieved at: October 24, 2005, http://instruct.uwo.ca/fim-lis/504/504gra.htm
[Friendly, 2005] Michael Friendly, The Lie Factor, Department of Mathematics and Statistics, Toronto, Last updated: February 23, 2002, Retrieved at: October 24, 2005, http://www.math.yorku.ca/SCS/Gallery/lie-factor.html


