File:Ue-infovis0910-group9-ue-3.png: Difference between revisions
Jump to navigation
Jump to search
Improved chart showing correlation between CO2 emissions and GDP per capita. |
(No difference)
|
Latest revision as of 19:56, 10 January 2010
Summary
Improved chart showing correlation between CO2 emissions and GDP per capita.
Copyright status
Source
File history
Click on a date/time to view the file as it appeared at that time.
| Date/Time | Thumbnail | Dimensions | User | Comment | |
|---|---|---|---|---|---|
| current | 22:41, 27 January 2010 | 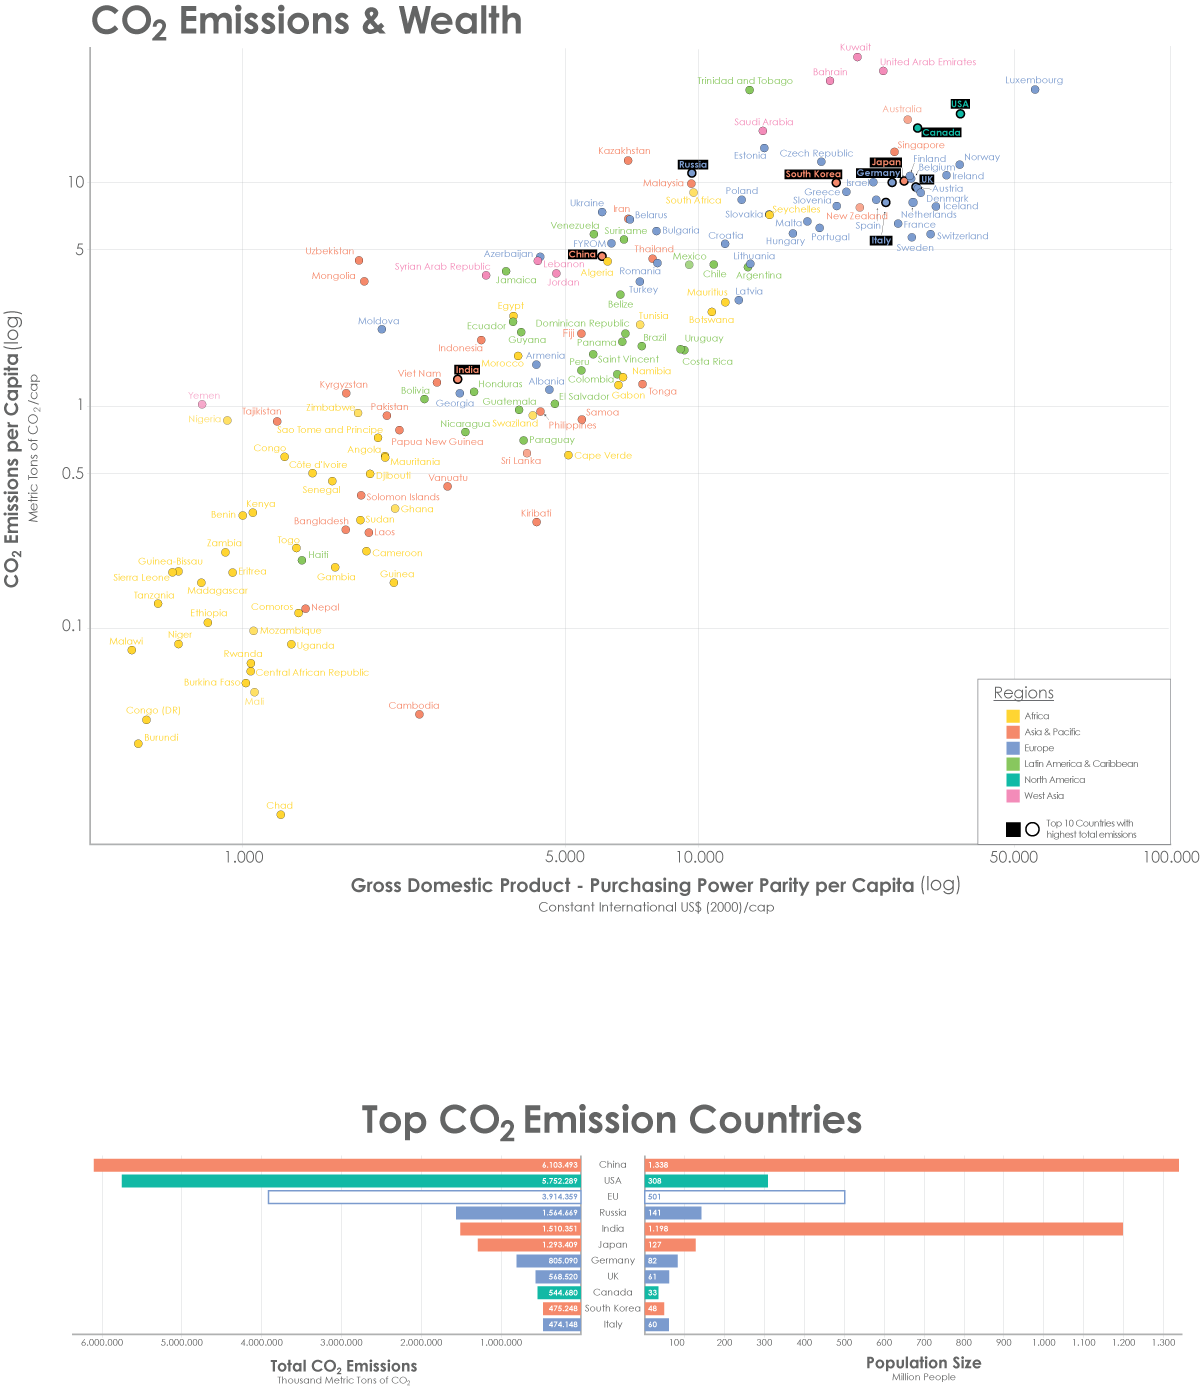 | 1,200 × 1,387 (151 KB) | UE-InfoVis0910 9930270 (talk | contribs) | |
| 19:56, 10 January 2010 | 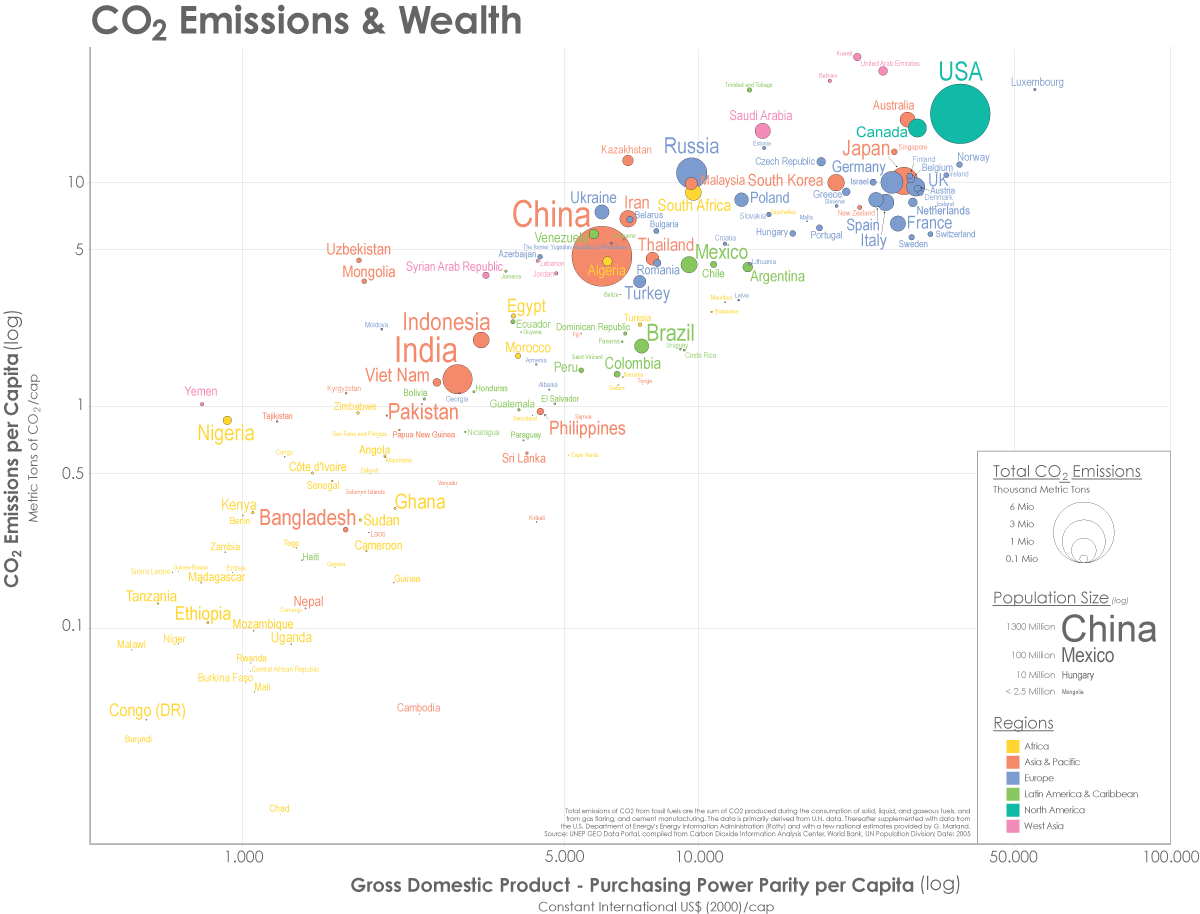 | 1,200 × 914 (143 KB) | UE-InfoVis0910 9930270 (talk | contribs) | Improved chart showing correlation between CO2 emissions and GDP per capita. |
You cannot overwrite this file.
File usage
The following page uses this file: