File:Scatterplot.GIF: Difference between revisions
Jump to navigation
Jump to search
New page: == Beschreibung == == Copyright status == == Source == |
No edit summary |
||
| Line 1: | Line 1: | ||
== | == Summary == | ||
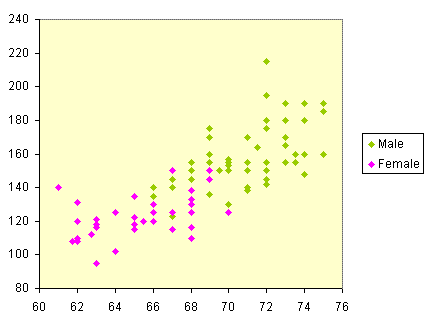
Number of data entries = 92 x 3 = 276 | |||
Data density = 276 / 41.4 = 6.7 (to 1 dp) | |||
== Copyright status == | == Copyright status == | ||
== Source == | == Source == | ||
[Hayden, 2008] Robert W. Hayden. Running for Excel: Multiple Regression with Qualitative Independent Variables I. http://courses.statistics.com/software/Excel/pulinf2.htm | |||
Latest revision as of 11:36, 21 November 2009
Summary
Number of data entries = 92 x 3 = 276
Data density = 276 / 41.4 = 6.7 (to 1 dp)
Copyright status
Source
[Hayden, 2008] Robert W. Hayden. Running for Excel: Multiple Regression with Qualitative Independent Variables I. http://courses.statistics.com/software/Excel/pulinf2.htm
File history
Click on a date/time to view the file as it appeared at that time.
| Date/Time | Thumbnail | Dimensions | User | Comment | |
|---|---|---|---|---|---|
| current | 11:26, 21 November 2009 |  | 428 × 320 (5 KB) | UE-InfoVis0910 0625847 (talk | contribs) |
You cannot overwrite this file.
File usage
There are no pages that use this file.