File:Figure13.jpg: Difference between revisions
Jump to navigation
Jump to search
Tree density plot showing percentage of nodes in subtrees at each level. |
(No difference)
|
Latest revision as of 19:51, 25 May 2009
Summary
Tree density plot showing percentage of nodes in subtrees at each level.
Copyright status
Source
File history
Click on a date/time to view the file as it appeared at that time.
| Date/Time | Thumbnail | Dimensions | User | Comment | |
|---|---|---|---|---|---|
| current | 19:51, 25 May 2009 | 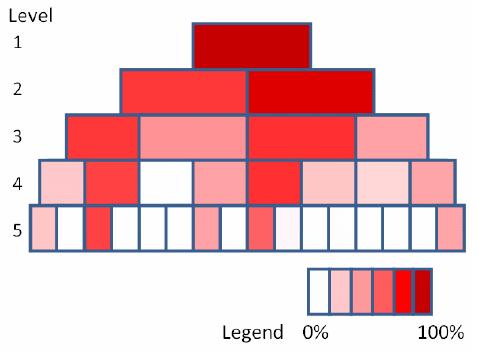 | 477 × 351 (17 KB) | UE-InfoVis09-03 (talk | contribs) | Tree density plot showing percentage of nodes in subtrees at each level. |
You cannot overwrite this file.
File usage
There are no pages that use this file.