File:689px-Piecharts.svg.png: Difference between revisions
Jump to navigation
Jump to search
Example of a pie chart, along with a bar plot showing the same data and indicating that the pie chart is not the best possible chart for this particular dataset. |
(No difference)
|
Latest revision as of 21:43, 26 November 2008
Summary
Example of a pie chart, along with a bar plot showing the same data and indicating that the pie chart is not the best possible chart for this particular dataset.
Copyright status
public domain
Source
File history
Click on a date/time to view the file as it appeared at that time.
| Date/Time | Thumbnail | Dimensions | User | Comment | |
|---|---|---|---|---|---|
| current | 21:43, 26 November 2008 | 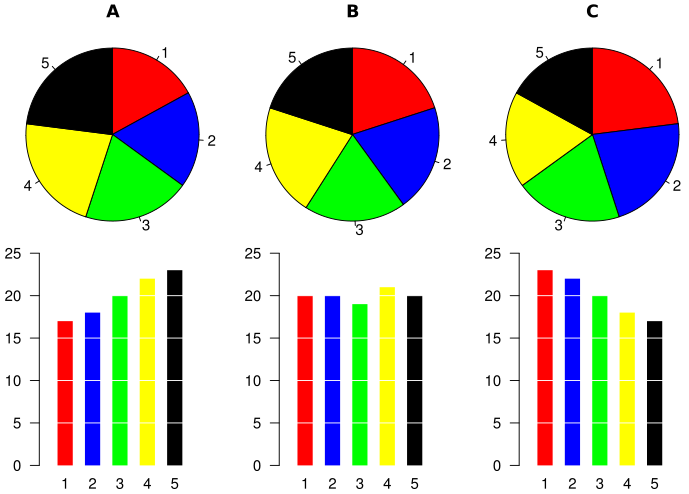 | 689 × 494 (45 KB) | UE-InfoVis0809 0728258 (talk | contribs) | Example of a pie chart, along with a bar plot showing the same data and indicating that the pie chart is not the best possible chart for this particular dataset. |
You cannot overwrite this file.
File usage
The following page uses this file: