CircleView: Difference between revisions
m Reverted edit of AabJna, changed back to last version by UE-InfoVis07-09 |
|
| (9 intermediate revisions by 2 users not shown) | |
(No difference)
| |
Latest revision as of 10:21, 6 September 2007
Authors
Short description
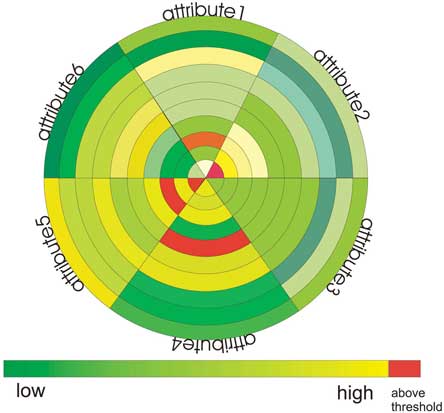
CircleView is a new approach for visualizing multidimensional time-referenced data sets. Due to the fact, that Continuous data is changing their characteristics over time, an appropriate visualization method is essential.
Therefore this new technique is a combination of hierarchical visualization techniques, such as treemaps, and circular layout techniques, such as Pie Charts and Circle Segments.
For users interested in analyzing such kind of data it is very important to identify patterns, exceptions and similarities, which is the main purpose this new visualization approach is developed for. CircleView supports the visualization of the changing characteristics over time to observe changes in the data. Therefore CircleView provides an intuitive and easy to understand visualization interface, which enables the user to gather all the information needed for analyzation. Additionally the application enables user interaction, such as different ordering options of the data, filtering methods and the possibility to define the period of time and speed of animation, which is visualized, to show both, real-time data and historical data.
Furthermore it is possible for the user to explore correlations and exceptions in the data, which is achieved by using similarity algorithms and ordering algorithms. So CircleView enables the user with every needed tool for an effective exploratory data analysis.
Figures
CircleView showing the evolution of multiple attributes over time.
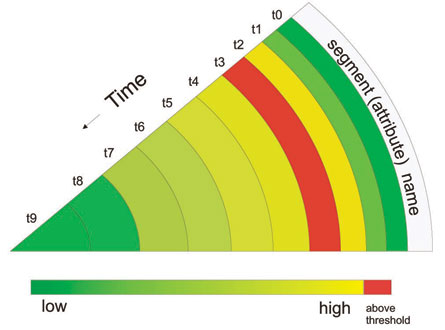
Illustration of a single CircleView segment: Evolution of the time events from the edge to the center.
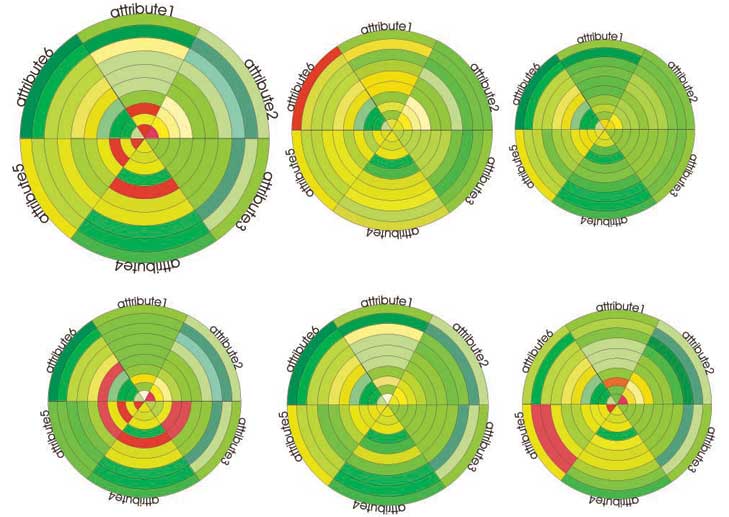
Combining Multi-level CircleView Displays showing the evolution of multiple attributes over time.
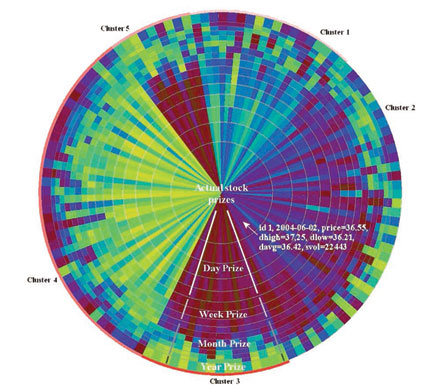
CircleView showing stock prices of 240 stocks from the S&P 500 over 6 months (120 business days). Each Segment represents a single stock and the subsegments represent stock prices. The most actual stock price are shown in the middle of the circle at full detail. For older stock prices the multiresolution approach presents average prices per week/month/year (outside of the circle).
Suitable Datatypes
Suitable Datatypes for this visualization technique are (fast) changing streams of data.
Important Citations
Internal Links
References
[Keim, D. et al. 2004] Keim et al. CircleView: a new approach for visualizing time-related multidimensional data sets. In JUCS Special Issue on Visual Data Mining, pages 179-182, Gallipoli, Italy, 2004: ACM Press.
[Keim, D. et al. 2004] Keim et al. Scalable Visual Data Exploration of Large Data Sets via MultiResolution. In Proceedings of the working conference on Advanced visual interfaces, Vol. 11, No. 11, pp. 1766-1779, 11, 2005.


