Circle Packing: Difference between revisions
| (31 intermediate revisions by 2 users not shown) | |||
| Line 1: | Line 1: | ||
== Authors == | == Authors == | ||
*[[Wang%2C_Hongan|Hongan Wang]] <br/> | *[[Wang%2C_Hongan|Hongan Wang]] <br/> | ||
*[[Dai%2C_Guozhong|Guozhong Dai]]<br/> | *[[Dai%2C_Guozhong|Guozhong Dai]]<br/> | ||
| Line 7: | Line 8: | ||
== Short description == | == Short description == | ||
Circle packing is a method to visualize large amounts of hierarchically structured data. Inspired by [[Treemap|treemaps]] and [http://www.grokker.com Grokker], Wang et al. developed this layout algorithm for tree structures: Tangent circles represent brother nodes at the same level; to visualize the hierarchy, all children of a node are packed into that node (and thus determine its size). The size of a leaf-node can represent an arbitrary property, such as file size. An advantage of this algorithm is the good overview of large data sets and the clear representation of groupings and structural relationships. | |||
As a space-filling technique, Circle Packing visualizes information as spatial extension. The algorithm on which it is based is related to the mathematical problem with the same name ([http://en.wikipedia.org/wiki/Sphere_packing#Circle_packing Wikipedia article]). It places any number of brother nodes, represented by circles, in an arrangement that has a high density and retains a convex shape approximating a circle as the amount of nodes grows. Due to this property, a set of brother nodes can always be packed into its (also circle-shaped) parent node. | |||
Compared to that of [[Treemap|treemaps]], a visualization generated by this technique is - while possibly a bit less space-efficient - easier to comprehend visually while it retains the ability to (theoretically) display all hierarchies at once. This, of course, requires an apt user interface to easily zoom into the structure if that is required to see the leaf nodes in detail. | |||
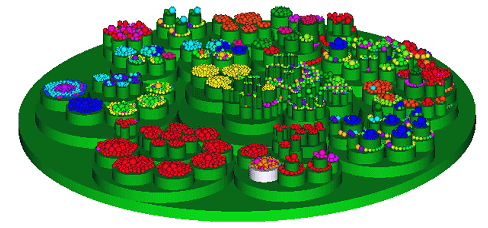
The authors have also demonstrated an extension of the visualization into the third dimension by using cylinders with a height value representing the level of a node. | |||
== | == Figures == | ||
The tree nodes at different levels are represented by nested circles. Brother nodes are packed into the root node. If a node has children they are packed into it. <br/> | The tree nodes at different levels are represented by nested circles. Brother nodes are packed into the root node. If a node has children they are packed into it. <br/> | ||
[[Image:Nodes.jpg]] <br/> | [[Image:Nodes.jpg]] <br/> | ||
Packing circles with random radii. The shape is basically convex. | |||
[[Image:Convex.gif]] <br/> | |||
| Line 31: | Line 44: | ||
== Suitable Datatypes == | == Suitable Datatypes == | ||
Suitable Datatypes for this visualization technique are (large) hierarchical data structures. | |||
== Important Citations == | == Important Citations == | ||
{{Quotation|The visualization of hierarchical information structures is an important topic in the visualization community. Most of the work concentrated on the challenge to display large hierarchies in a comprehensible form.| [Wang, W. et al., 2006]}} | |||
{{Quotation|The circles of different radii are suitable for representing large numbers of brother nodes. There is no overlapping between any two circles, which ensures each circle is visible. The circles are to be packed as close as possible to save display space. A new circle is always placed outside the front-chain and beside the circle whose center is nearest to the origin, which ensures that the shape of front-chain is basically convex like a circle.| [Wang, W. et al., 2006]}} | |||
{{Quotation|The layout algorithm for tree visualization leads to a simultaneously clearer and more compact visualization of a hierarchy than rectangular views and node-link diagrams. The visualization has the advantage over retangular layouts of allowing even very small nodes to remain visible without contorted aspect ratios. Though the use of display space is not more efficient than rectangular layouts, the space is helpful to see structural relationships and is easy to select (click) a node.| [Wang, W. et al., 2006]}} | |||
== Evaluation == | == Evaluation == | ||
Twenty-one students tested the file visualization tool for two weeks. Their feedback was a 67 percent positive rating, a 22 percent neutral rating and a 11 percent negative rating. | |||
Mentioned advantages: | |||
*robust and efficient for thousands of files | |||
*friendly interface which is easy to use | |||
*interface needs less operation than traditional files management systems to find a file | |||
*user interface has a high efficiency | |||
*clear bird view of the whole files | |||
*quickly zoom in/out | |||
Mentioned disadvantages: | |||
*difficult to display a long file name fully | |||
*no file names shown in 3D view | |||
*difficult to do copy/paste-operations | |||
==Internal Links== | == Internal Links == | ||
*[[Treemap]] | *[[Treemap]] | ||
== External Links == | |||
[grokker] [http://www.grokker.com. Grokker] | |||
== References == | == References == | ||
[Wang, W. et al. 2006] [http://portal.acm.org/citation.cfm?doid=1124772.1124851 Wang et al. Visualization of large hierarchical data by circle packing.] In ''Proceedings of the SIGCHI conference on Human Factors in computing systems'', pages 517-520, Montréal, Québec, Canada, 2006: ACM Press. | [Wang, W. et al. 2006] [http://portal.acm.org/citation.cfm?doid=1124772.1124851 Wang et al. Visualization of large hierarchical data by circle packing.] In ''Proceedings of the SIGCHI conference on Human Factors in computing systems'', pages 517-520, Montréal, Québec, Canada, 2006: ACM Press. | ||
== Evaluation Reference == | |||
[Wang, W. et al. 2006] [http://portal.acm.org/citation.cfm?doid=1124772.1124851 Wang et al. Visualization of large hierarchical data by circle packing.] In ''Proceedings of the SIGCHI conference on Human Factors in computing systems'', pages 517-520, Montréal, Québec, Canada, 2006: ACM Press. | |||
[[Category:Techniques]] | [[Category:Techniques]] | ||
Latest revision as of 15:27, 25 April 2007
Authors
- Hongan Wang
- Guozhong Dai
- Weixin Wang
- Hui Wang
Short description
Circle packing is a method to visualize large amounts of hierarchically structured data. Inspired by treemaps and Grokker, Wang et al. developed this layout algorithm for tree structures: Tangent circles represent brother nodes at the same level; to visualize the hierarchy, all children of a node are packed into that node (and thus determine its size). The size of a leaf-node can represent an arbitrary property, such as file size. An advantage of this algorithm is the good overview of large data sets and the clear representation of groupings and structural relationships.
As a space-filling technique, Circle Packing visualizes information as spatial extension. The algorithm on which it is based is related to the mathematical problem with the same name (Wikipedia article). It places any number of brother nodes, represented by circles, in an arrangement that has a high density and retains a convex shape approximating a circle as the amount of nodes grows. Due to this property, a set of brother nodes can always be packed into its (also circle-shaped) parent node.
Compared to that of treemaps, a visualization generated by this technique is - while possibly a bit less space-efficient - easier to comprehend visually while it retains the ability to (theoretically) display all hierarchies at once. This, of course, requires an apt user interface to easily zoom into the structure if that is required to see the leaf nodes in detail.
The authors have also demonstrated an extension of the visualization into the third dimension by using cylinders with a height value representing the level of a node.
Figures
The tree nodes at different levels are represented by nested circles. Brother nodes are packed into the root node. If a node has children they are packed into it.
Packing circles with random radii. The shape is basically convex.
3D nested cylinders and spheres
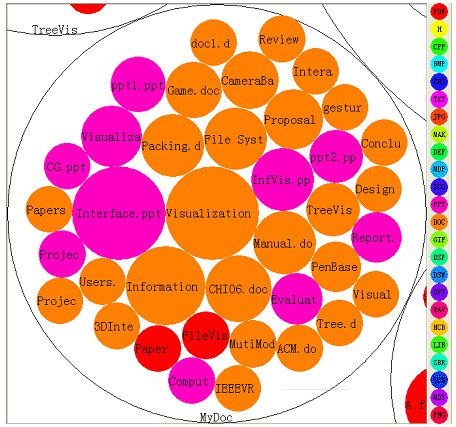
Userinterface: directories are represented by white circles.
The Color of the inner circles shows the filetype and the file sizes determine the radii.
Suitable Datatypes
Suitable Datatypes for this visualization technique are (large) hierarchical data structures.
Important Citations
Evaluation
Twenty-one students tested the file visualization tool for two weeks. Their feedback was a 67 percent positive rating, a 22 percent neutral rating and a 11 percent negative rating.
Mentioned advantages:
- robust and efficient for thousands of files
- friendly interface which is easy to use
- interface needs less operation than traditional files management systems to find a file
- user interface has a high efficiency
- clear bird view of the whole files
- quickly zoom in/out
Mentioned disadvantages:
- difficult to display a long file name fully
- no file names shown in 3D view
- difficult to do copy/paste-operations
Internal Links
External Links
[grokker] Grokker
References
[Wang, W. et al. 2006] Wang et al. Visualization of large hierarchical data by circle packing. In Proceedings of the SIGCHI conference on Human Factors in computing systems, pages 517-520, Montréal, Québec, Canada, 2006: ACM Press.
Evaluation Reference
[Wang, W. et al. 2006] Wang et al. Visualization of large hierarchical data by circle packing. In Proceedings of the SIGCHI conference on Human Factors in computing systems, pages 517-520, Montréal, Québec, Canada, 2006: ACM Press.


