File:DQI rangeslider.png: Difference between revisions
Jump to navigation
Jump to search
A sample range slider. By moving the arrows, the user specifies the range, which is represented by the white rectangle. The numbers above the arrows give the current range. The numbers on the far ends of the range slider are the extreme values that the at |
(No difference)
|
Latest revision as of 13:58, 30 October 2006
Summary
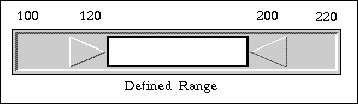
A sample range slider. By moving the arrows, the user specifies the range, which is represented by the white rectangle. The numbers above the arrows give the current range. The numbers on the far ends of the range slider are the extreme values that the attribute can take.
Copyright status
Source
[Tanin, 1997] Egemen Tanin, Background on Dynamic Queries. Created at: Jan 2, 1997. Retrieved at: October 28, 2006 http://hcil.cs.umd.edu/trs/96-18/node8.html.
File history
Click on a date/time to view the file as it appeared at that time.
| Date/Time | Thumbnail | Dimensions | User | Comment | |
|---|---|---|---|---|---|
| current | 13:58, 30 October 2006 | 358 × 104 (4 KB) | UE-InfoVis0607 0025559 (talk | contribs) | A sample range slider. By moving the arrows, the user specifies the range, which is represented by the white rectangle. The numbers above the arrows give the current range. The numbers on the far ends of the range slider are the extreme values that the at |
You cannot overwrite this file.
File usage
The following page uses this file: