Tracking and Organizing Visual Exploration Activities across Systems and Tools
Author[edit]
Short description[edit]
Dennis P. Groth claims that there is not only a wealth of information within common visualization systems, but also within the user's interaction with the actual system. He states that while it is no doubt important for a single user to gain knowledge und to come to certain conclusions while using a visualization system, it is equally important that other users are can easily understand and reproduce the results. Therefore he suggests to employ a system that actually visualizes the user's interactions with the existing visualization system.
Exploring these interactions utilizes various visualization techniques for knowledge discovery in order to unveil implicit phonemes. As most exploration settings take place in a highly diverse environment employing multiple activities, individuals and locations tracking and processing is quite challenging.
Commonly used interactive visualizations are not only limited to a single application in question but also disseminating findings for further exploration are not provided adequately.
The presented framework employs a fine-grained provenance tracking.
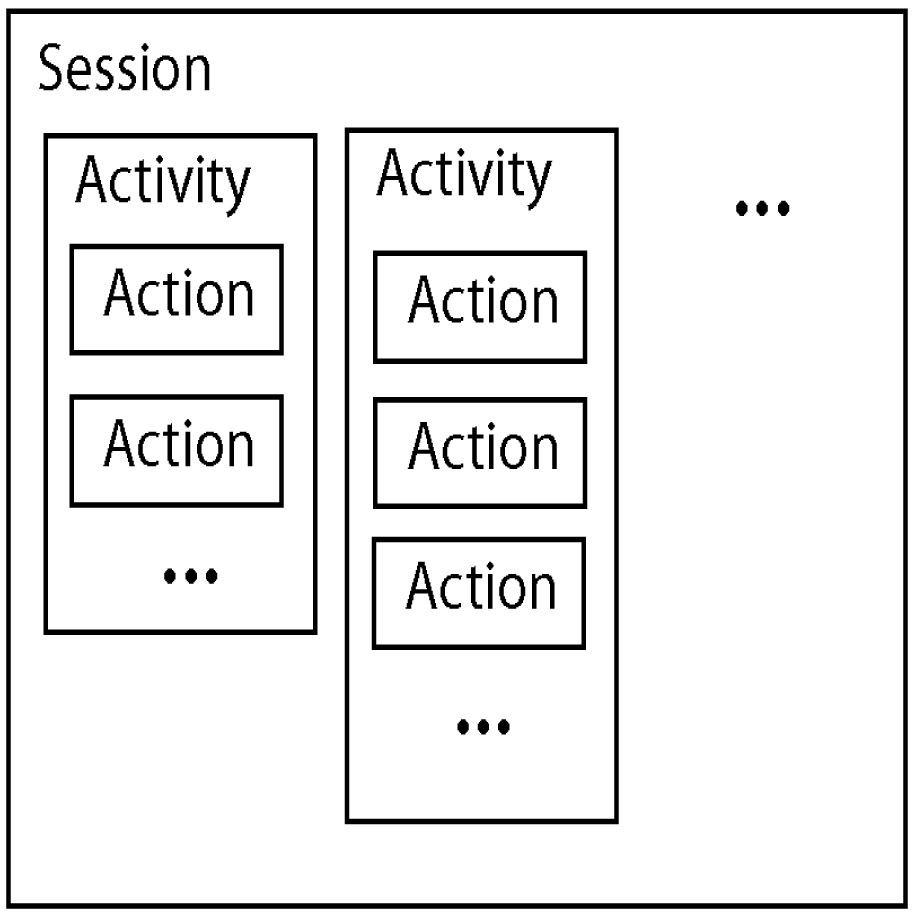
Generally this framework is based on three building blocks:
- Session (the overall block containing multiple activities)
- Activity (represents a single application (e.g. visualization system, browser, etc.))
- Action (User actions like zooming, rotating an image or even browsing through the web)

Schematic view of building blocks
As multiple activities arise within a session a logical linkage evolves. In general, three types of linkage are given:
- Serial events representing a temporal order
- Branching relations when actions are considered as logical states
- Association when action happens across activities
From the arithmetic perspective this framework can be described as a directed graph.
Nodes
describes state of the system, whereby branches occur when the user reverts to an earlier state of an activity. Hence the user is able to browse through the exploration history afterwards.
Edges
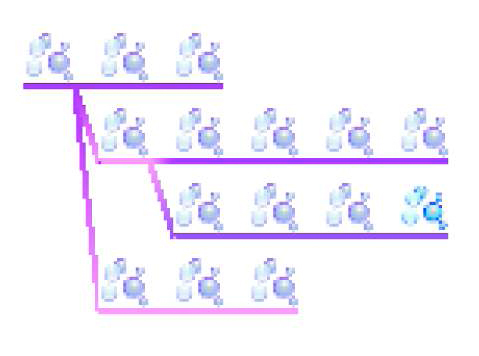
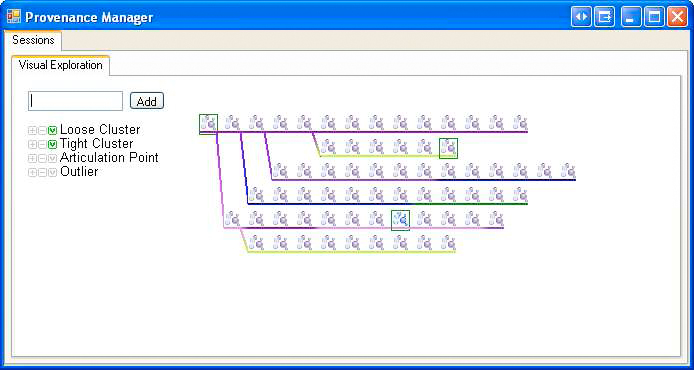
transitions among the states. the latest implementation of proposed frameworks supports colored edges indicating different activities.
![]()
Simple Timeline, temporal order

Branching timeline
Therefore a minor tagging theme is implemented whether tagging is manually or automatically associated with a given action. Hence another type of clustering actions and alternate graph representations are provided.

Annotations via Tagging
However, this project is still in construction as further extensions are progressed. So an API is going to be provided in order to link applications in question into the provenance tracking system. Furthermore more explorations on automated tagging scheme are underway.
References[edit]
[Groth, D.P. 2004] Information Provenance and the Knowledge Rediscovery Problem In Proceedings of the Information Visualisation, Eighth International Conference, pages 345 - 351, Washington, DC, USA, 2004: IEEE Computer Society
[Groth, D.P. 2007] Tracking and Organizing Visual Exploration Activities across Systems and Tools In Proceedings of the 11th International Conference Information Visualization, pages 11-16, Washington, DC, USA, 2007: IEEE Computer Society