Patterns:Navigation Box: Difference between revisions
(Created page) |
(Created page) |
||
| Line 9: | Line 9: | ||
== Context == | == Context == | ||
The display consists of an Overview and Detail. | |||
== Problem == | == Problem == | ||
How to allow the user to navigate the data space via the overview. | |||
== Forces == | == Forces == | ||
* A simple mechanism for altering the contents of the detailed view. | |||
* Clear indication of item(s) being viewed in detail. This may include both the size and location for continuous data. | |||
== Solution == | == Solution == | ||
''' | '''Place a moveable location indicator within the overview.''' | ||
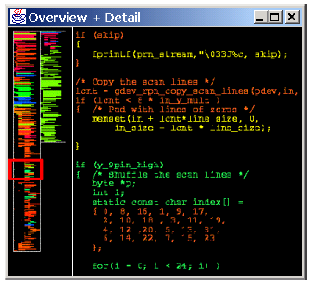
There should be a visual location indicator in the overview. Often this is | |||
simply a rectangle that represents both the location and area of the | |||
dataset being viewed. The user can then click and drag this indicator to | |||
the desired location and the contents of the detailed view should be | |||
updated accordingly. Similarly if the contents of the detailed view can | |||
be altered by some other means e.g. scrollbars, then the location | |||
indicator in the overview should be moved to reflect this change. In this | |||
way the location indicator and the detailed view are kept in sync. | |||
Whilst dragging the indicator the detailed view may be continuously | |||
updated (Smooth Transitions). Alternatively the detailed view may | |||
only update when the mouse button is released, in which case | |||
Teleportation is often an option. | |||
== Examples == | == Examples == | ||
* SeeSoft <ref>Eick, S. G., Steffen, J. L., Sumner, E. E. (1992). SeeSoft - A Tool for Visualizing Line | |||
Oriented Software Statistics. IEEE Transactions on Software Engineering, 18(11), pp 957-968.</ref> | |||
[[Image:navbox.png|150px|thumb|Film Finder]] | |||
* The Information Mural<ref>Jerding D. F. and Stasko J.T. (1997). The Information Mural: A Technique for Displaying and | |||
Navigating Large Information Spaces. Graphics, Visualization and Usability Center, College of Computing, Georgia Institute of Technology, Atlanta. Technical Report; GIT-GVU-97-24.</ref> | |||
== Related Patterns == | == Related Patterns == | ||
* [[Smooth Transitions]] | |||
* [[Teleportation]] | |||
== References == | == References == | ||
Wilkins, B., (2003). “MELD: A Pattern Supported Methodology for Visualisation Design”, PhD Dissertation, University of Birmingham, UK. | <references/> | ||
See Also: Wilkins, B., (2003). “MELD: A Pattern Supported Methodology for Visualisation Design”, PhD Dissertation, University of Birmingham, UK. | |||
Revision as of 14:32, 9 October 2007
Summary
Category
Interaction
Context
The display consists of an Overview and Detail.
Problem
How to allow the user to navigate the data space via the overview.
Forces
- A simple mechanism for altering the contents of the detailed view.
- Clear indication of item(s) being viewed in detail. This may include both the size and location for continuous data.
Solution
Place a moveable location indicator within the overview.
There should be a visual location indicator in the overview. Often this is simply a rectangle that represents both the location and area of the dataset being viewed. The user can then click and drag this indicator to the desired location and the contents of the detailed view should be updated accordingly. Similarly if the contents of the detailed view can be altered by some other means e.g. scrollbars, then the location indicator in the overview should be moved to reflect this change. In this way the location indicator and the detailed view are kept in sync. Whilst dragging the indicator the detailed view may be continuously updated (Smooth Transitions). Alternatively the detailed view may only update when the mouse button is released, in which case Teleportation is often an option.
Examples
- SeeSoft [1]

- The Information Mural[2]
Related Patterns
References
- ↑ Eick, S. G., Steffen, J. L., Sumner, E. E. (1992). SeeSoft - A Tool for Visualizing Line Oriented Software Statistics. IEEE Transactions on Software Engineering, 18(11), pp 957-968.
- ↑ Jerding D. F. and Stasko J.T. (1997). The Information Mural: A Technique for Displaying and Navigating Large Information Spaces. Graphics, Visualization and Usability Center, College of Computing, Georgia Institute of Technology, Atlanta. Technical Report; GIT-GVU-97-24.
See Also: Wilkins, B., (2003). “MELD: A Pattern Supported Methodology for Visualisation Design”, PhD Dissertation, University of Birmingham, UK.