File:Midgaard validtime granularity.jpg
Original file (1,134 × 128 pixels, file size: 13 KB, MIME type: image/jpeg)
Summary[edit]
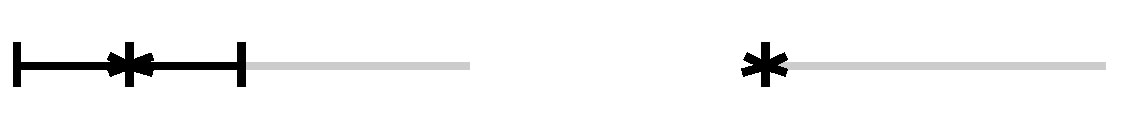
The valid time of a value is represented by a gray horizontal line. The granularity of a data point (left: a more coarse occurrence time than the actual timeline scale, right: a more precise occurrence time) is represented by a small mark or by an extended mark capturing the uncertainties.
Copyright status[edit]
Source[edit]
[Bade et al., 2004] Ragnar Bade, Stefan Schlechtweg, and Silvia Miksch. Connecting Time-oriented Data and Information to a Coherent Interactive Visualization. In Proceedings of the SIGCHI Conference on Human Factors in Computing Systems (CHI 04), pages 105–112, Vienna, Austria, ACM Press, April 2004. (pdf)
File history
Click on a date/time to view the file as it appeared at that time.
| Date/Time | Thumbnail | Dimensions | User | Comment | |
|---|---|---|---|---|---|
| current | 19:20, 26 May 2009 | 1,134 × 128 (13 KB) | UE-InfoVis09-05 (talk | contribs) | The valid time of a value is represented by a gray horizontal line. The granularity of a data point (left: a more coarse occurrence time than the actual timeline scale, right: a more precise occurrence time) is represented by a small mark or by an extende |
You cannot overwrite this file.
File usage
The following page uses this file: