File:Figure14.jpg
No higher resolution available.
Figure14.jpg (485 × 282 pixels, file size: 24 KB, MIME type: image/jpeg)
File history
Click on a date/time to view the file as it appeared at that time.
| Date/Time | Thumbnail | Dimensions | User | Comment | |
|---|---|---|---|---|---|
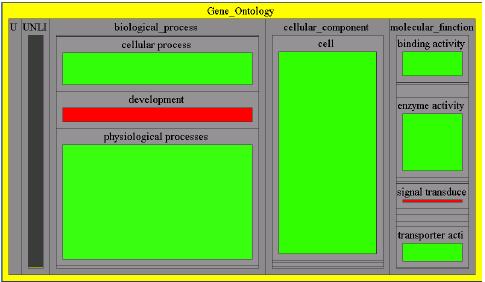
| current | 20:51, 25 May 2009 | | 485 × 282 (24 KB) | UE-InfoVis09-03 (talk | contribs) | A treemap density plot showing a 3-level summary of gene expression data for a 23-level tree with 22,995 nodes. |
You cannot overwrite this file.
File usage
There are no pages that use this file.