2007-02-15: New issue of Inf@Vis! (infovis.net) on "InfoVis Diagram" available: Difference between revisions
Jump to navigation
Jump to search
No edit summary |
m (Reverted edits by 118.69.226.73 (Talk); changed back to last version by Iwolf) |
| (One intermediate revision by one other user not shown) | |
(No difference)
| |
Latest revision as of 09:35, 1 September 2010
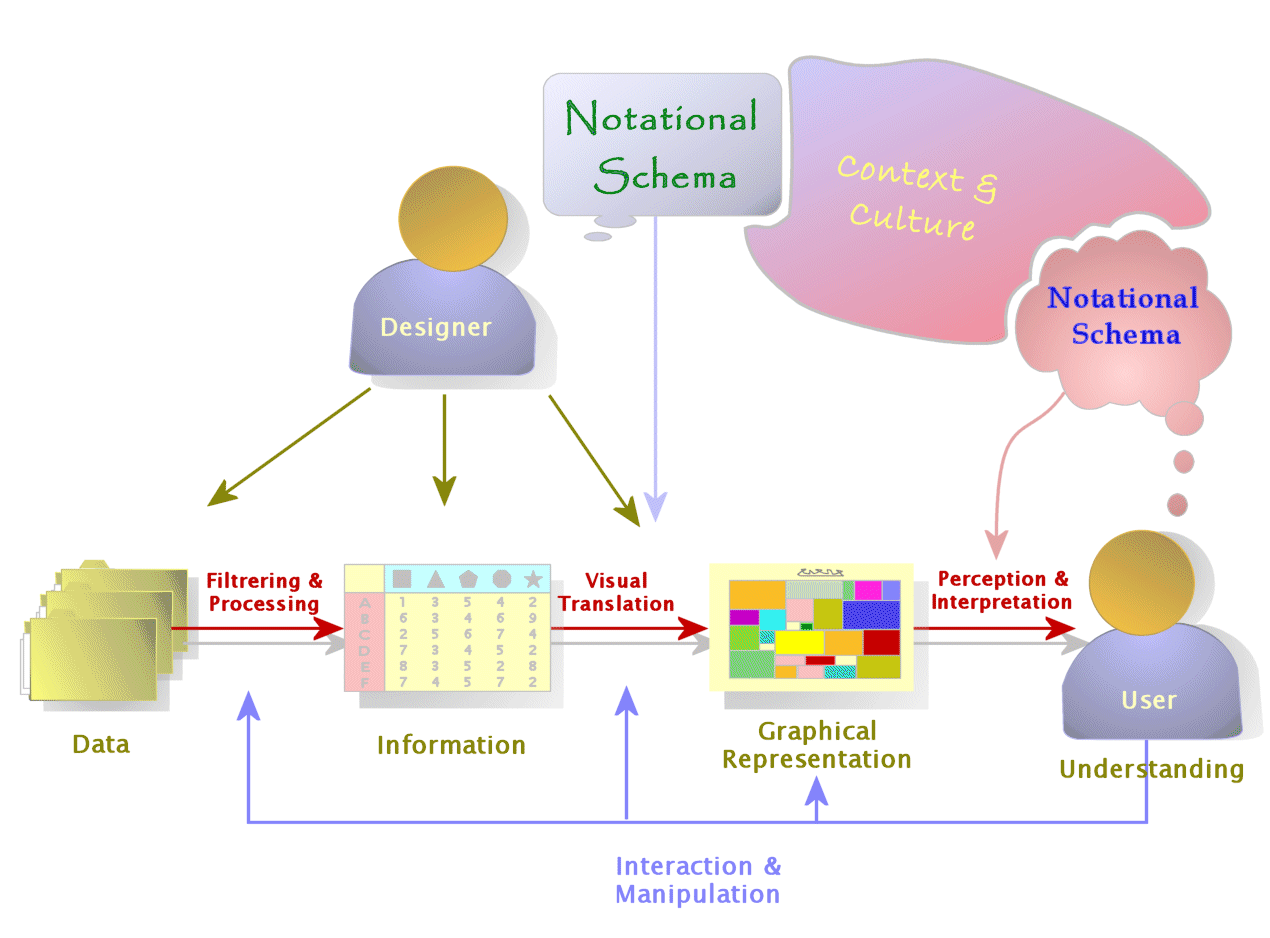
The new issue of Inf@Vis! (The digital magazine of InfoVis.net) on InfoVis Diagram is the second part of the analysis of the process of Information Visualization which leads from data to understanding:

[Dürsteler, 2007]
In this issue we describe the diagram for the process of Information Visualisation as seen by Yuri Engelhardt and the author after a series of discussions about its nature and the process that leads from Data to Understanding.
[Dürsteler, 2007]
Full article: http://www.infovis.net/printMag.php?num=187&lang=2
References[edit]
[Dürsteler, 2007] Juan C. Dürsteler, InfoVis Diagram, Inf@Vis! (The digital magazine of InfoVis.net), Created at: Feb. 12, 2007, Retrieved at: Feb. 15, 2007, http://www.infovis.net/printMag.php?num=187&lang=2